Flexible Table Builder - User guide
The Flexible Table Builder allows users to create their own tables by combining census variables.
This guidance includes:
- instructions for using the table builder
- example of building tables
Stage 1 – Opening a dataset
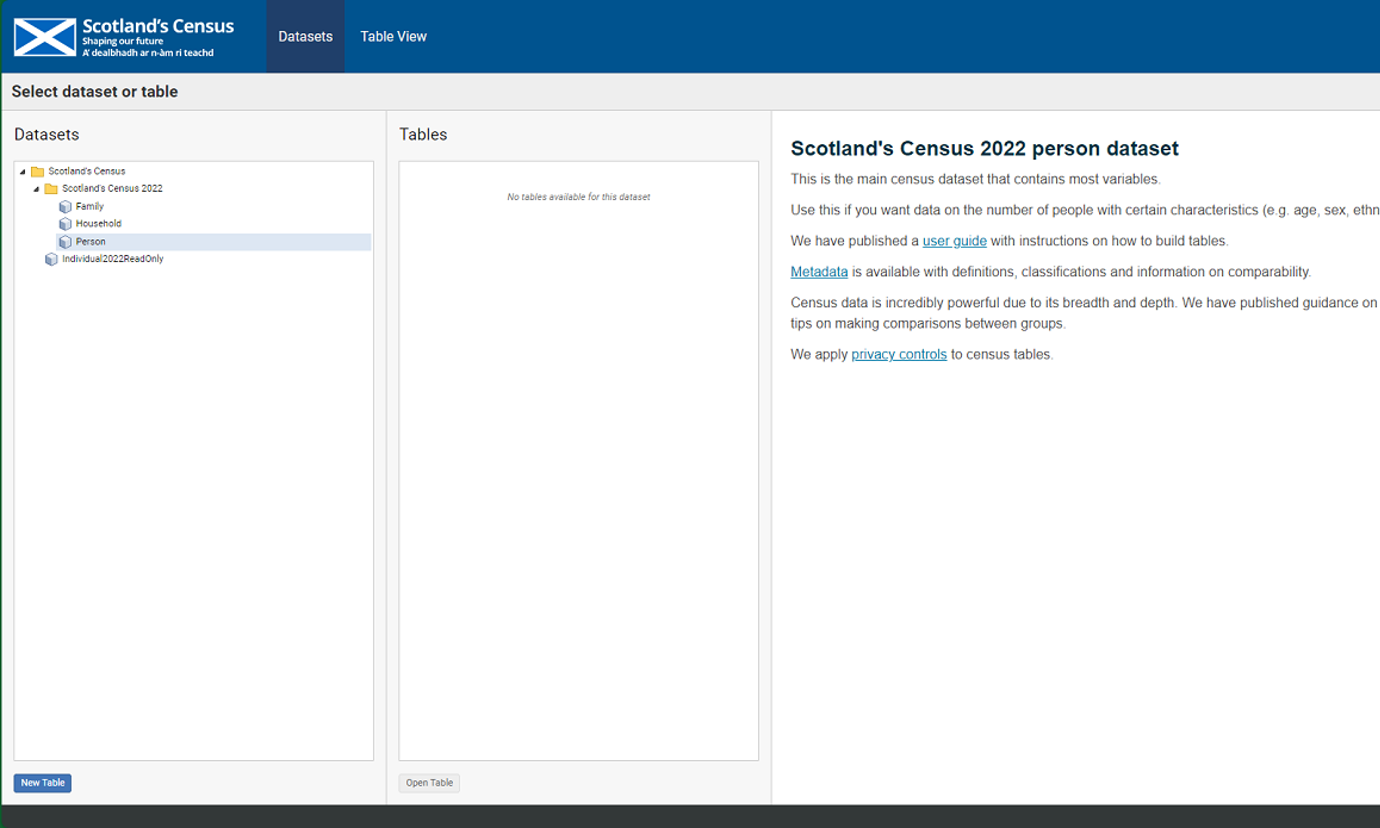
After launching the table builder and agreeing to the user agreement you will be brought to the flexible table builder catalogue explorer page. This page has three sections:
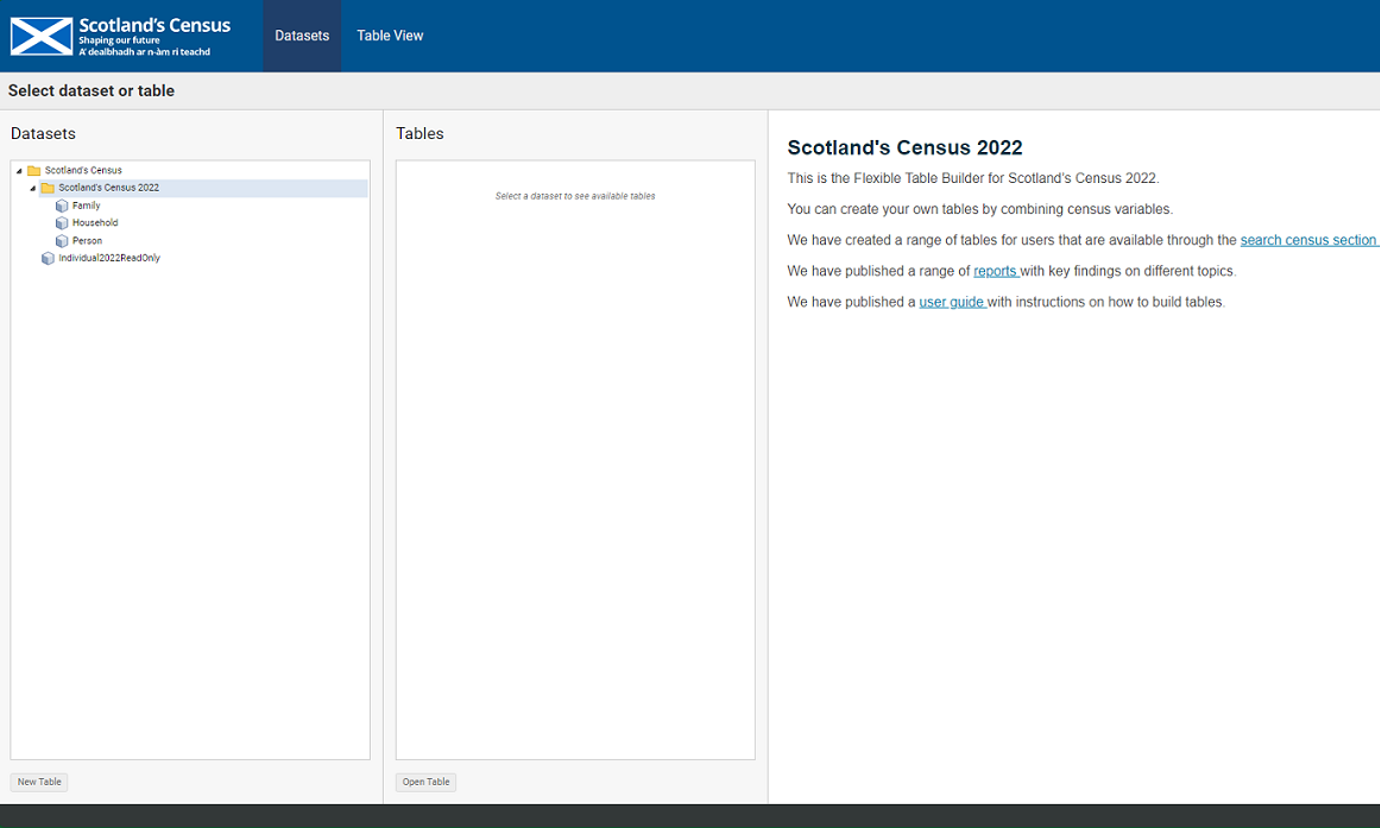
Datasets, where you select the dataset you want to build your table from
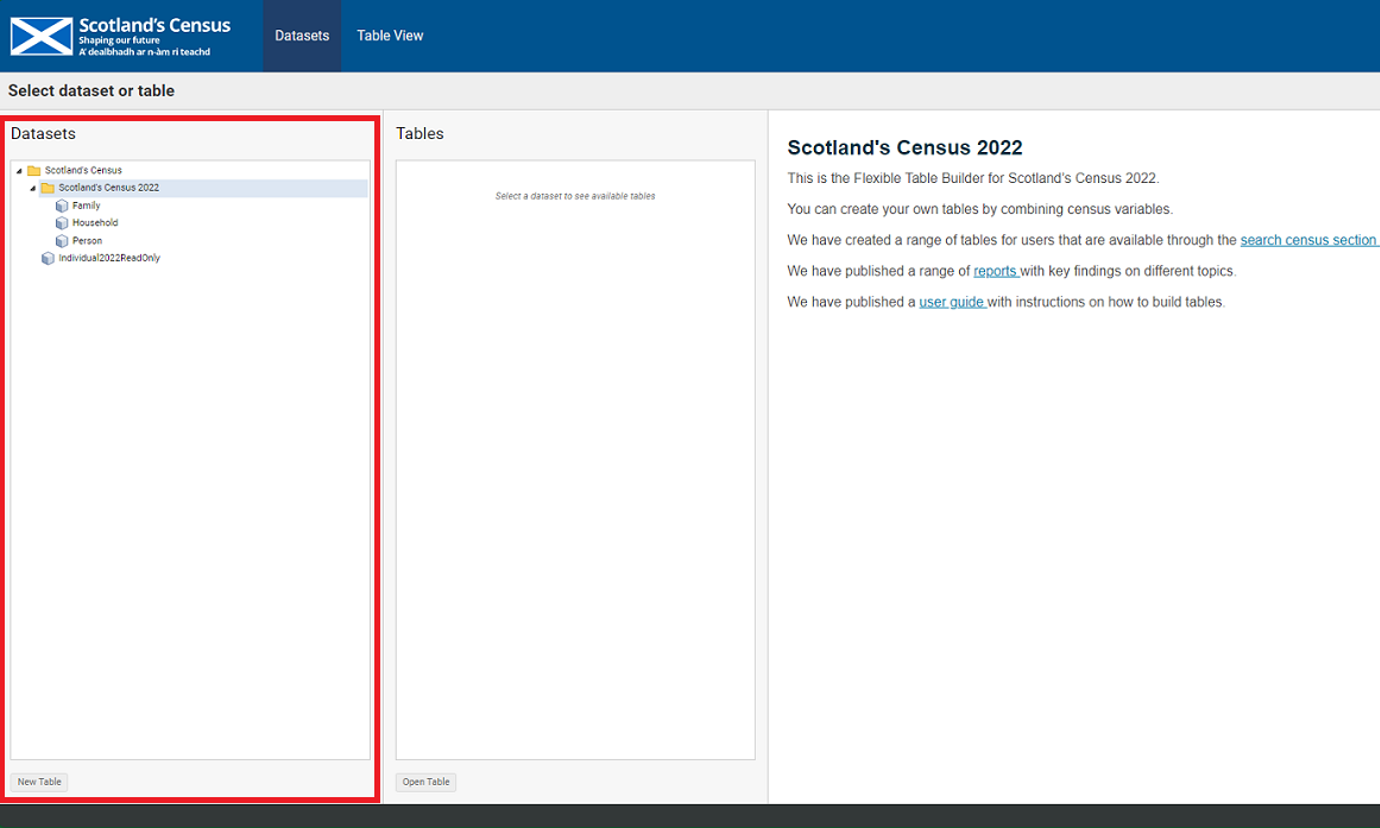
Tables, where you can select pre-made tables which you can open, rearrange and add or remove variables from
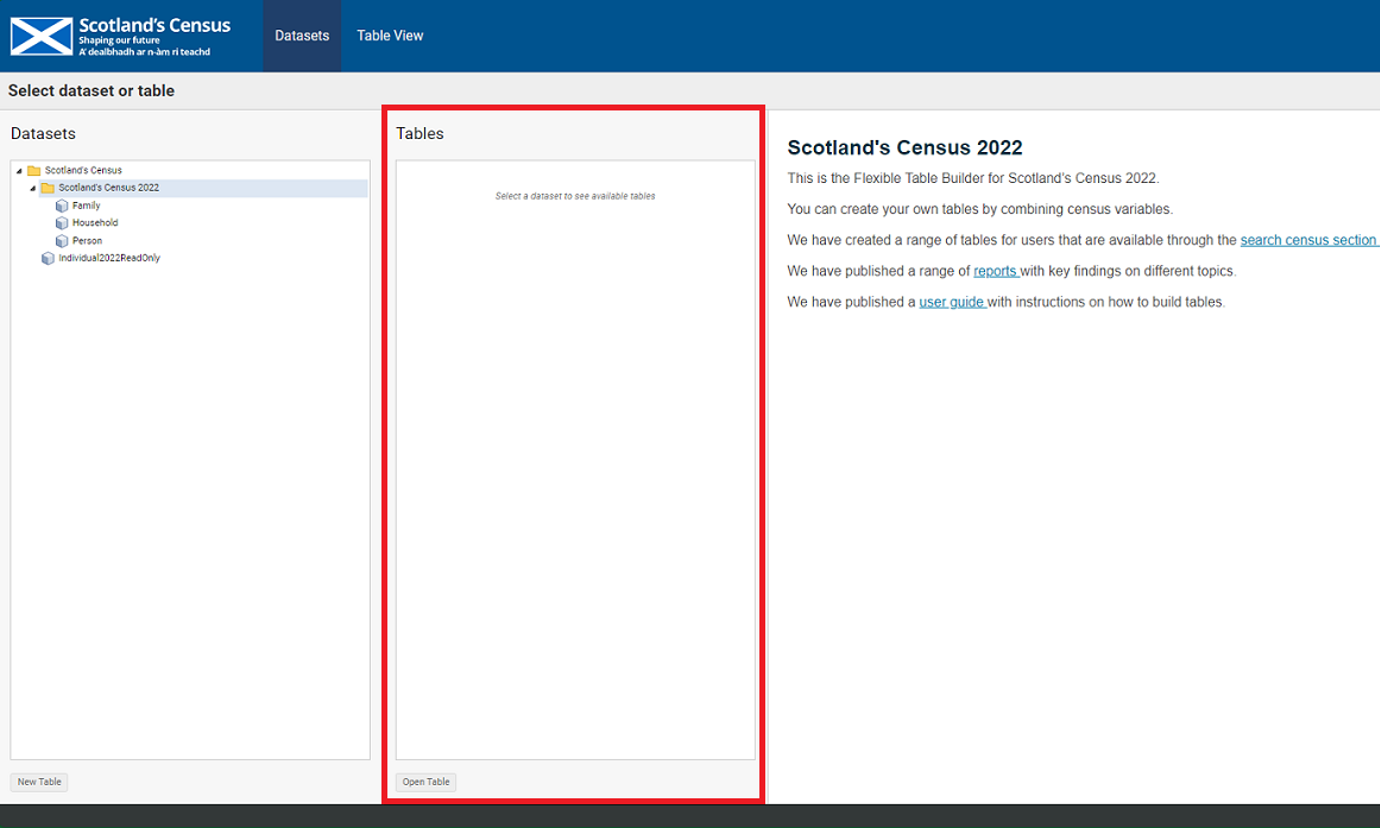
More information, where you can find a quick summary of what the table builder does
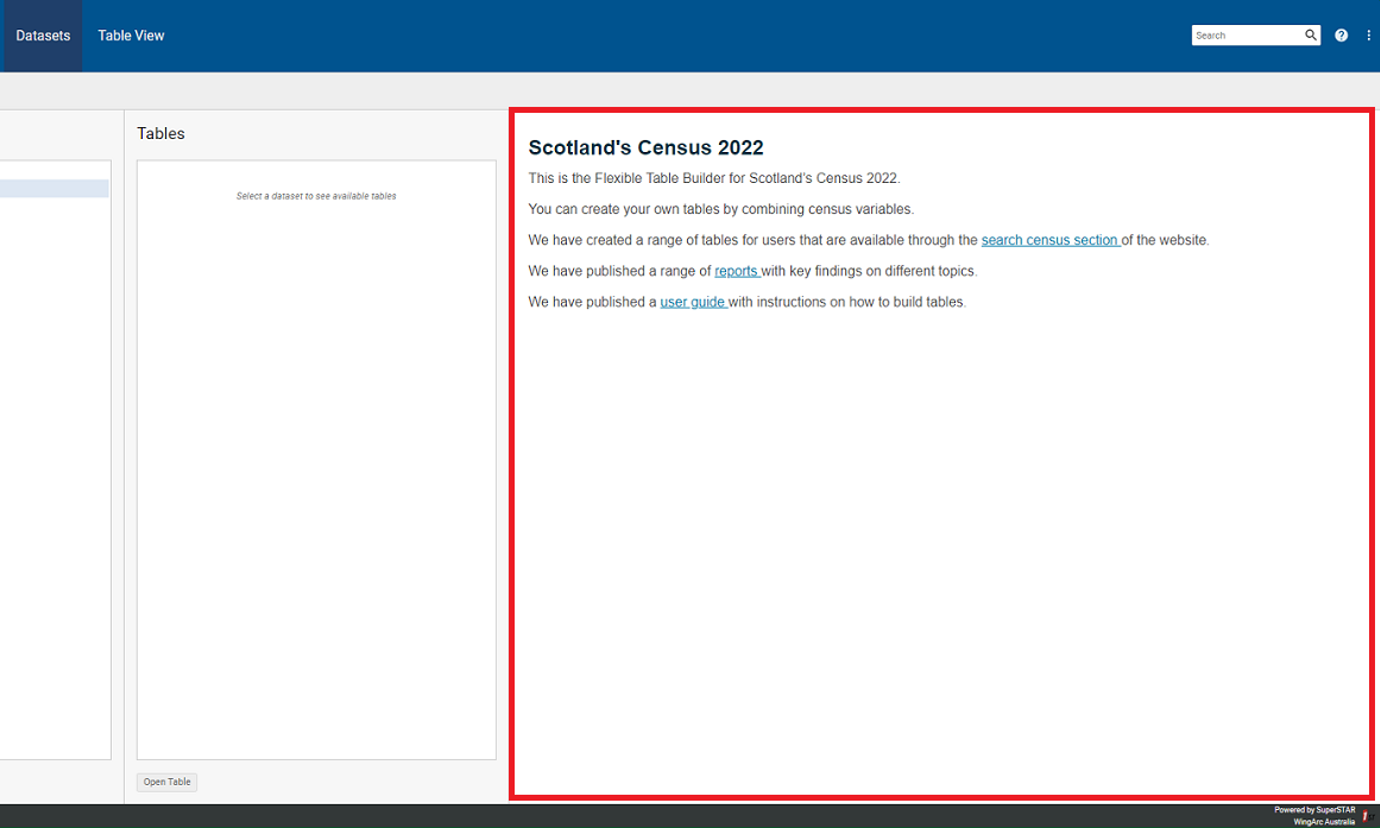
To get started you can either:
- double click the dataset which you wish to use to build your table
- build your table by expanding off one of our pre-built solutions
To build your own table, click once on the dataset you wish to use, and a list of pre-built tables will appear in the Tables section. You can then select the table you are interested in from this list and double click it to open it.
Stage 2 – Table view
After selecting a dataset and/or table you wish to start working with, you will be navigated to the Table view page which is split into two sections:
- Dataset Manager, where you can view the variables contained in this dataset and select ones to use to build your table
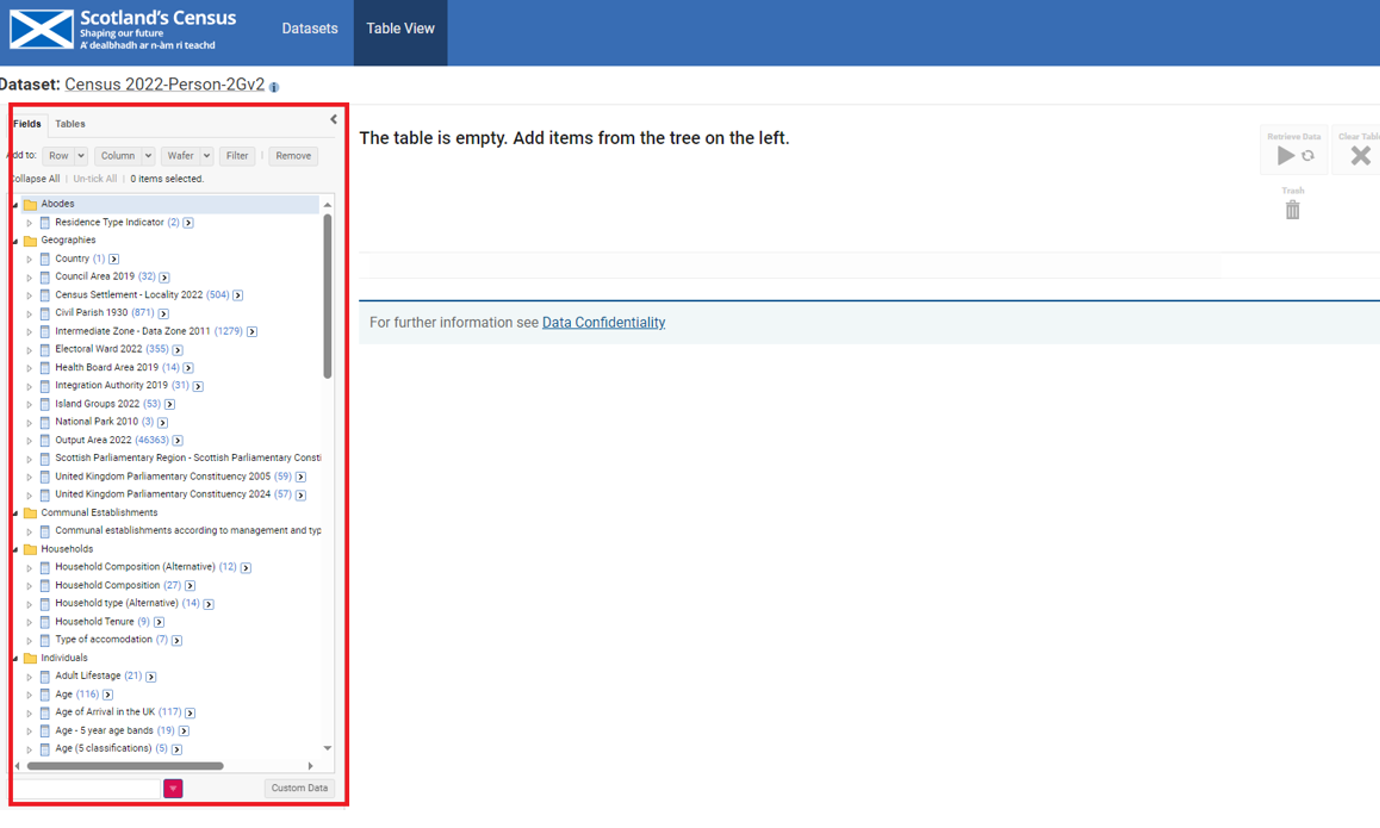
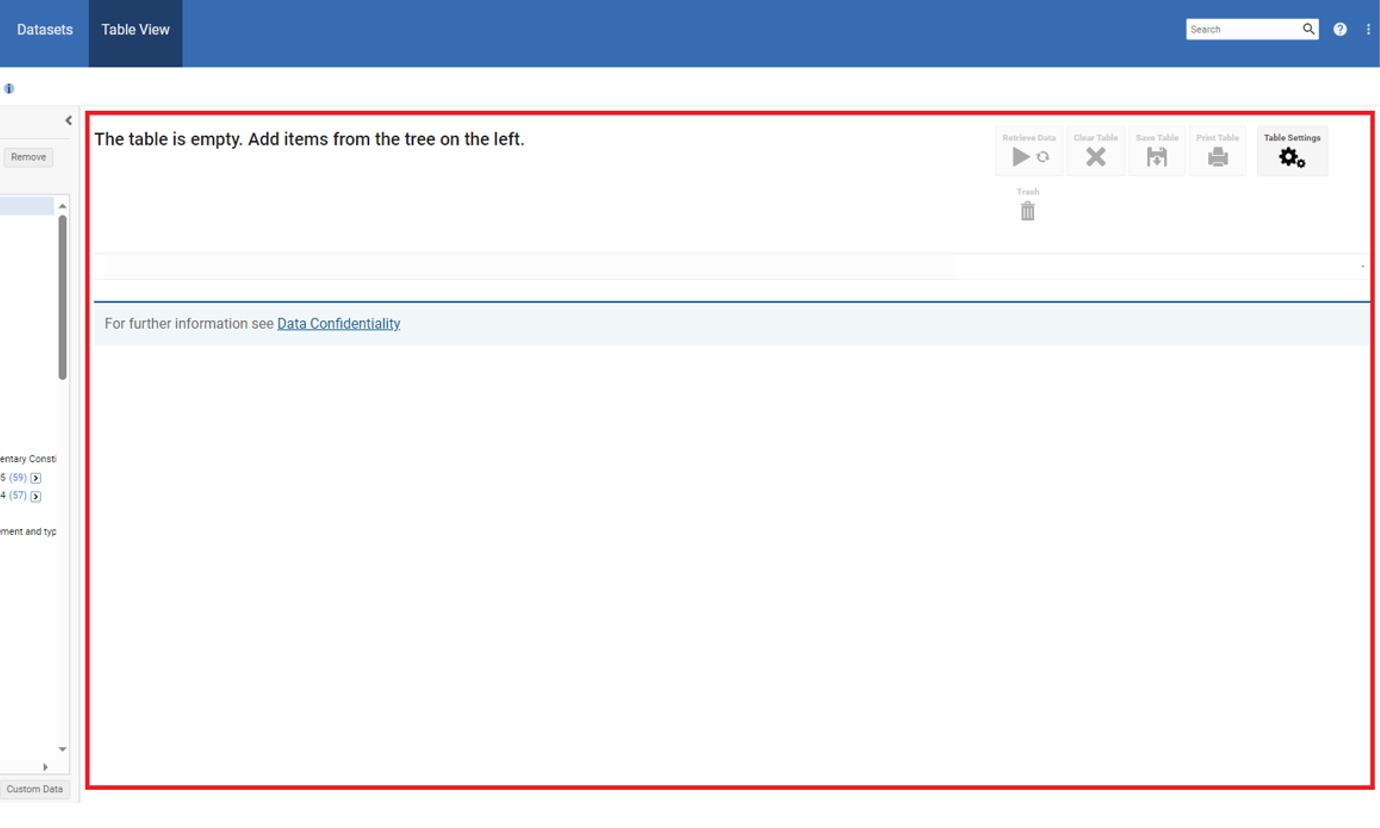
Table Manager, which displays the table options such as retrieving selected data, clearing the table, saving the table, printing the table and changing table setting are located.
Stage 3 – Dataset manager
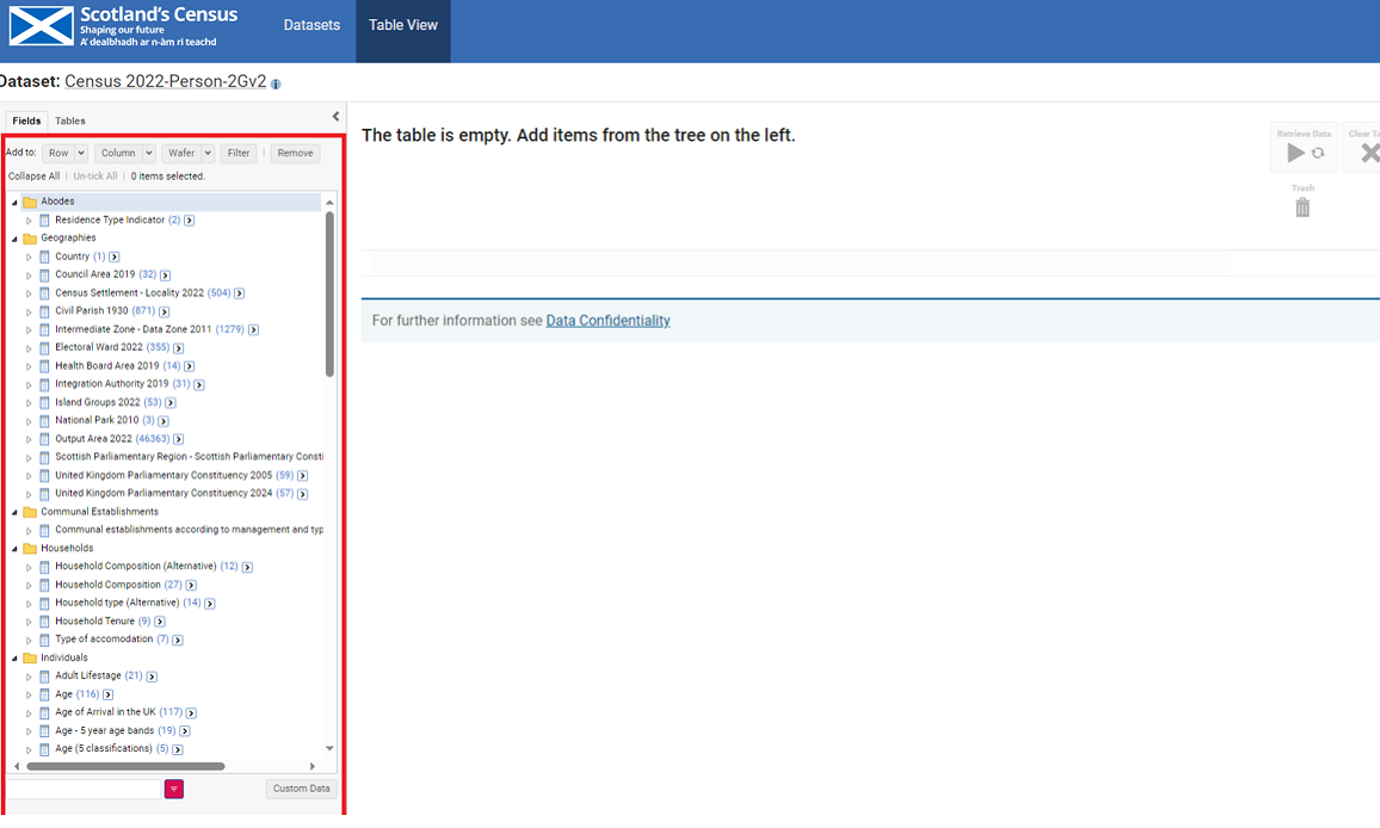
The dataset manager has two sections:
Fields - this is the section you will use to select variables to be added to your table and assign them to either rows or columns
Tables – this is a section similar to the tables section from the catalogue explorer page, from which you can select pre-built tables that use the variables from this dataset
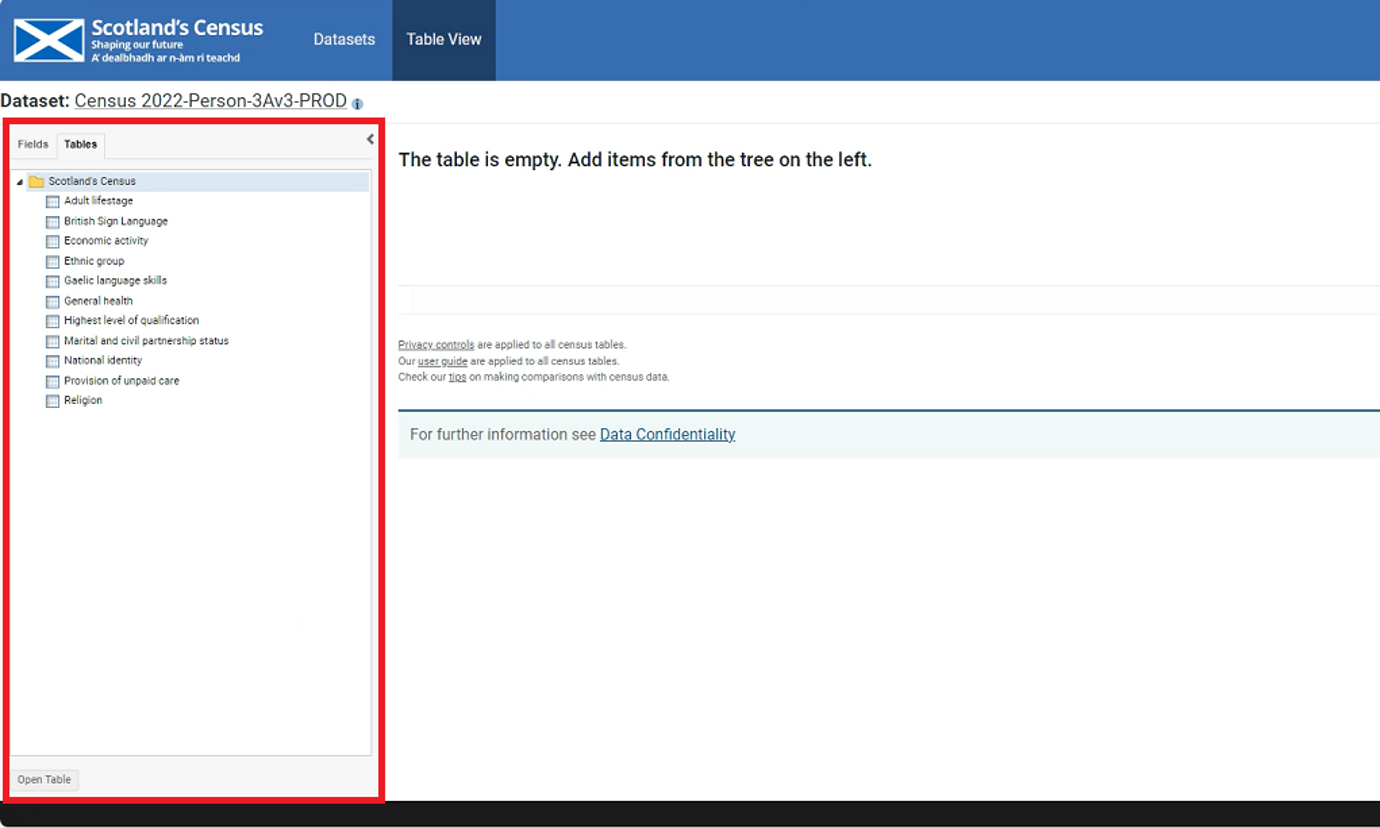
The fields section is composed of:
- an “Add to” section
- a dataset viewer section.
Within the dataset viewer section, the variables that make up our dataset are sorted into different categories such as:
- Armed Forces veterans
- Demography (Age, sex etc.)
- Education, labour market and travel to work
- Ethnic group, national identity, language and religion
- Family
- Geography
- Health, disability and unpaid care
- Household
- Indicators and filters
- Migration
In the “Add to” section, you are given the option of adding a variable to a row, a column or a wafer.
To build a table from the dataset viewer:
- Select the variable you want to add, then you
- Drag it to the area you want to store it within your table.
For example, if you want a variable to be stored as rows in my table, select it and drag it to row. Currently, the maximum amount of variables you can combine into a table is 4.
Stage 4 – Table manager
The table manager has six buttons:
Retrieve Data – once you have selected the variables you wish to use in your table through the dataset manager, click this button to have the table viewer load the data for those variables.
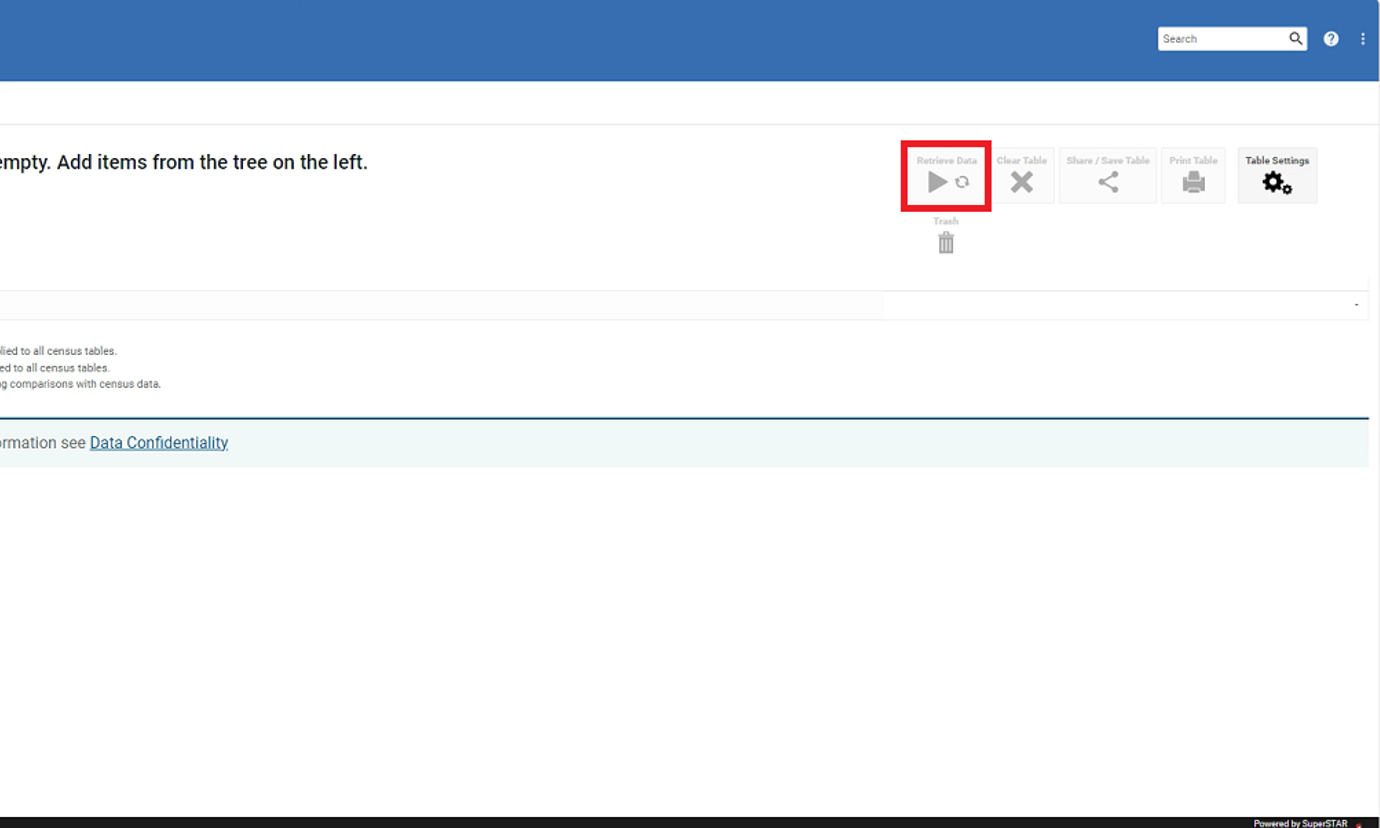
Clear Table - this button clears the table, removing all selected variables and data from the table view.
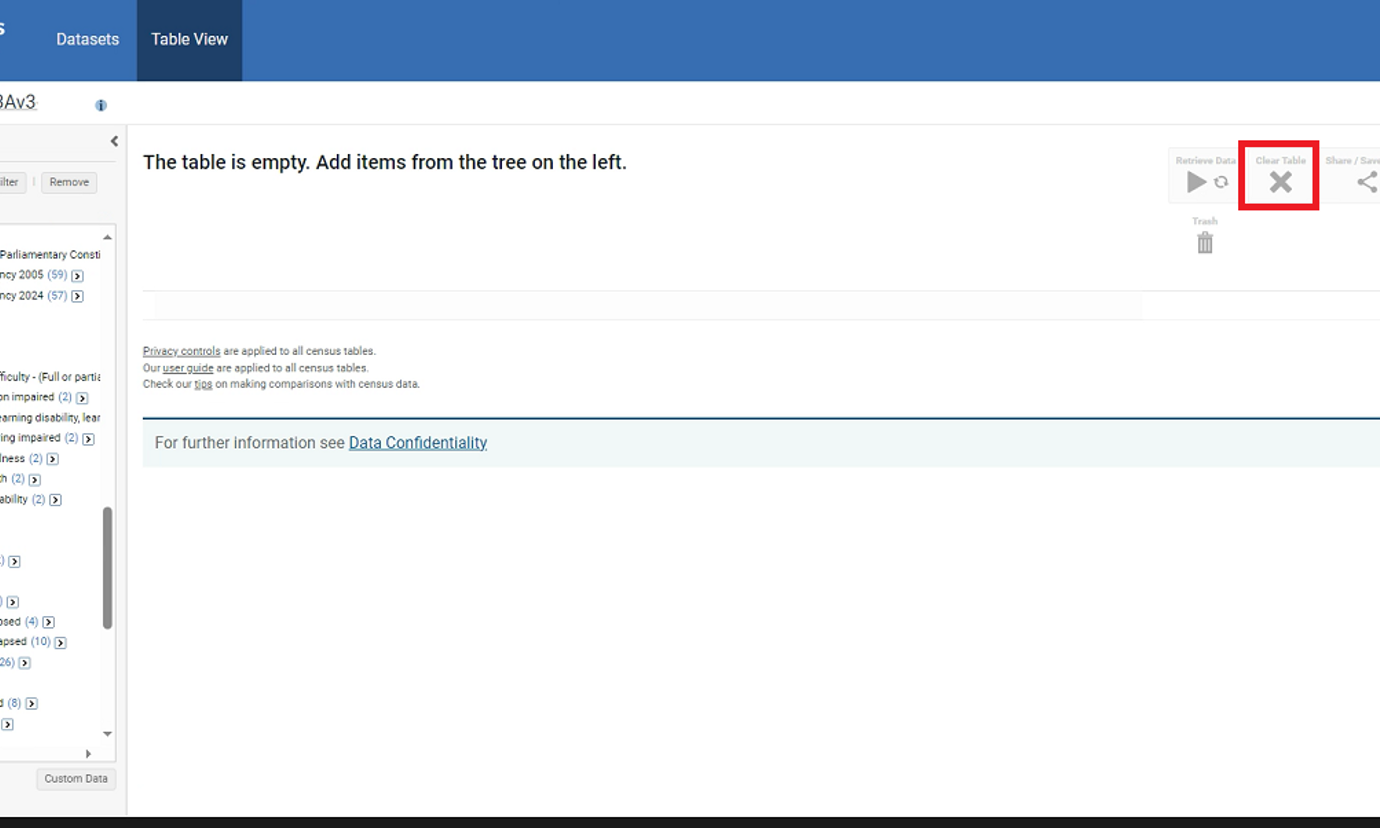
Share / save Table - this button generates a URL which will link back to the table created.
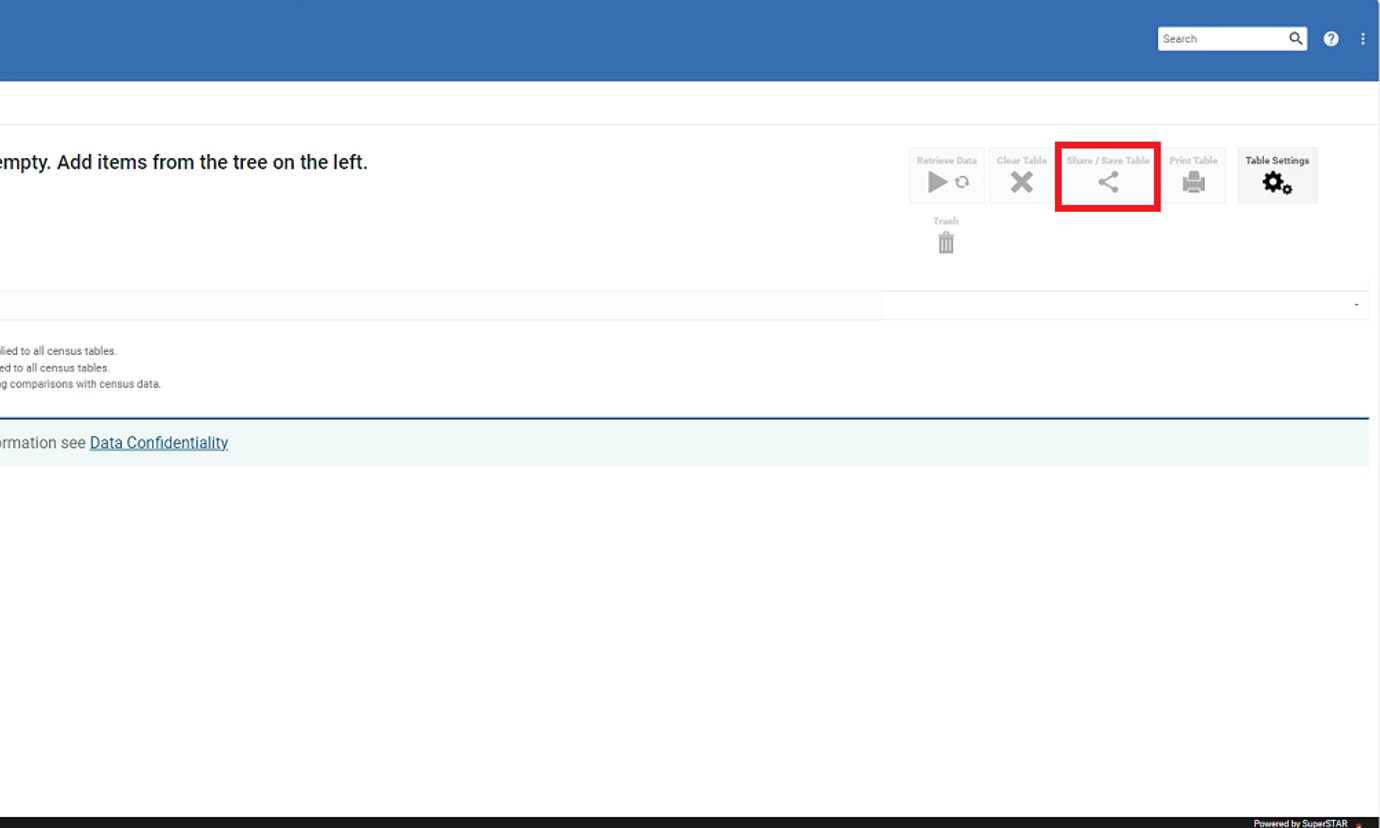
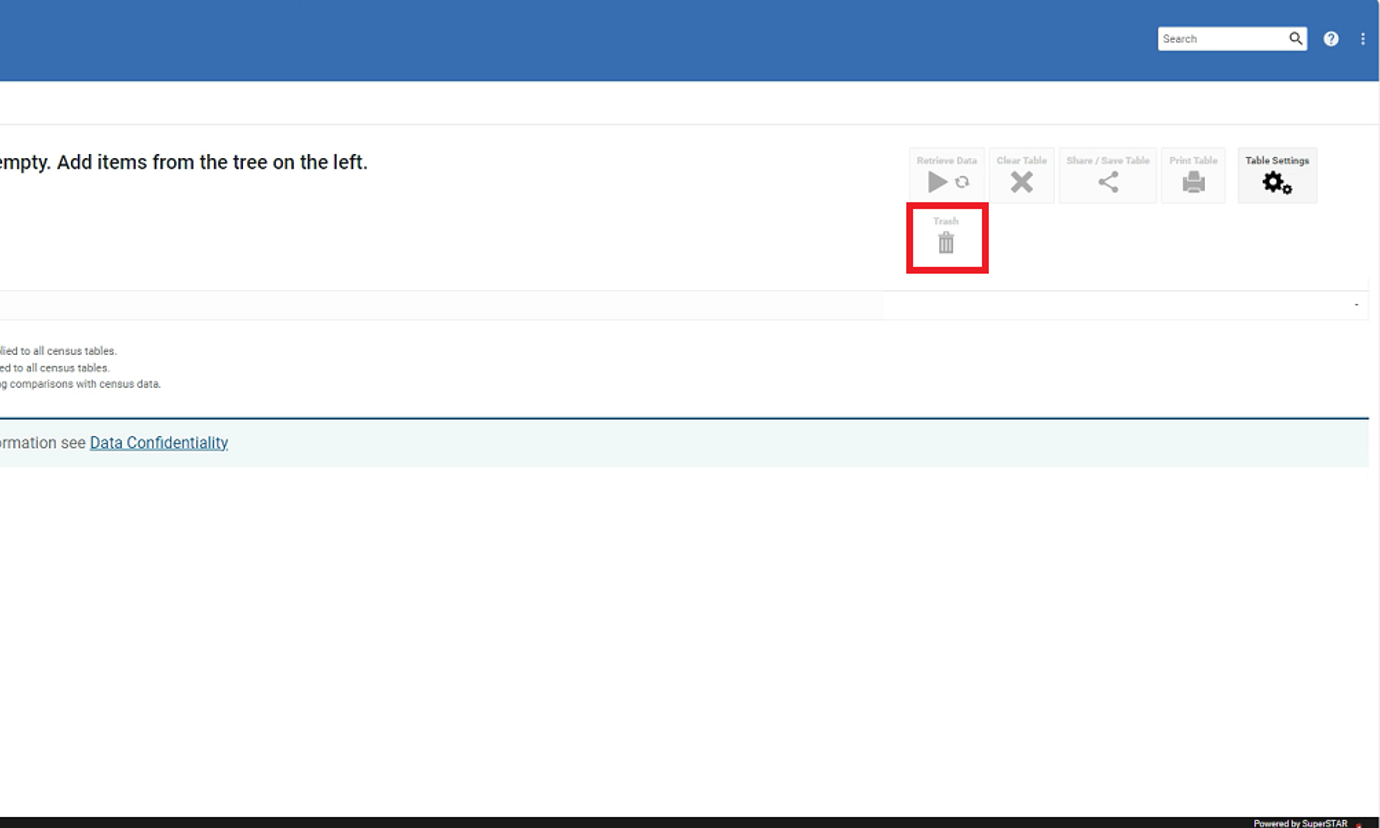
Print Table – this button allows you to print your table.
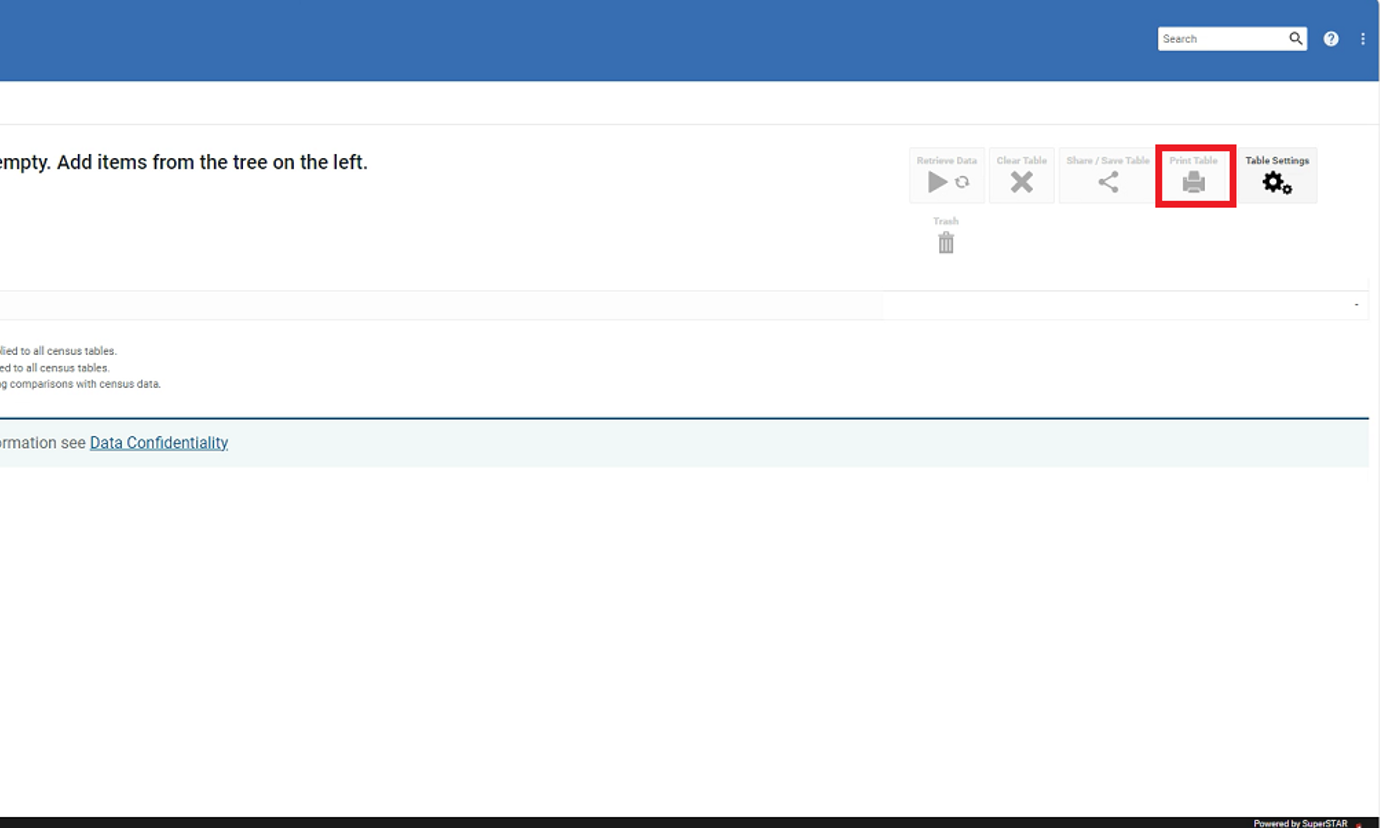
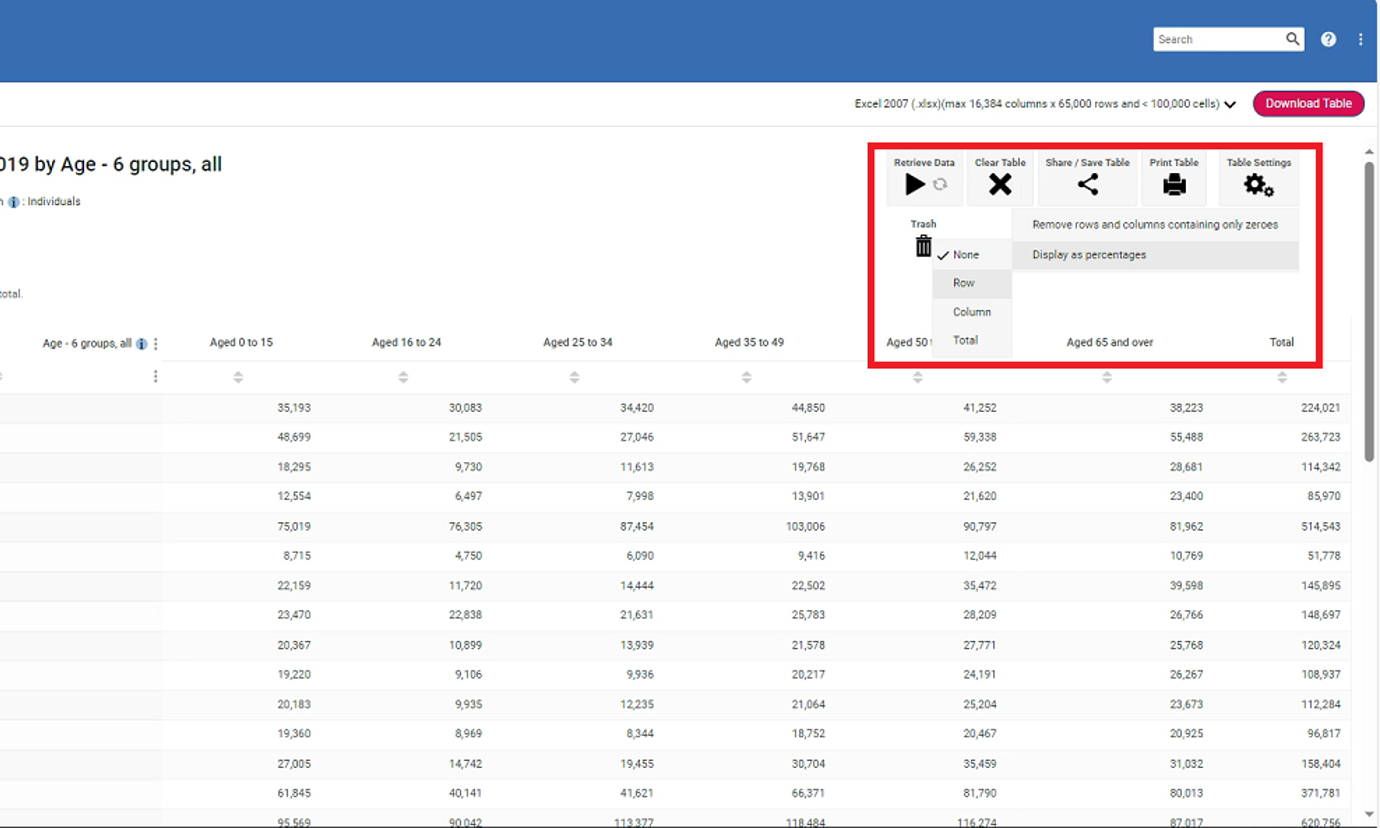
Table Settings – this button allows you to manipulate your table by giving you the ability to remove rows or columns containing only zeroes, or to change your data from displaying as a count to displaying as a percentage.
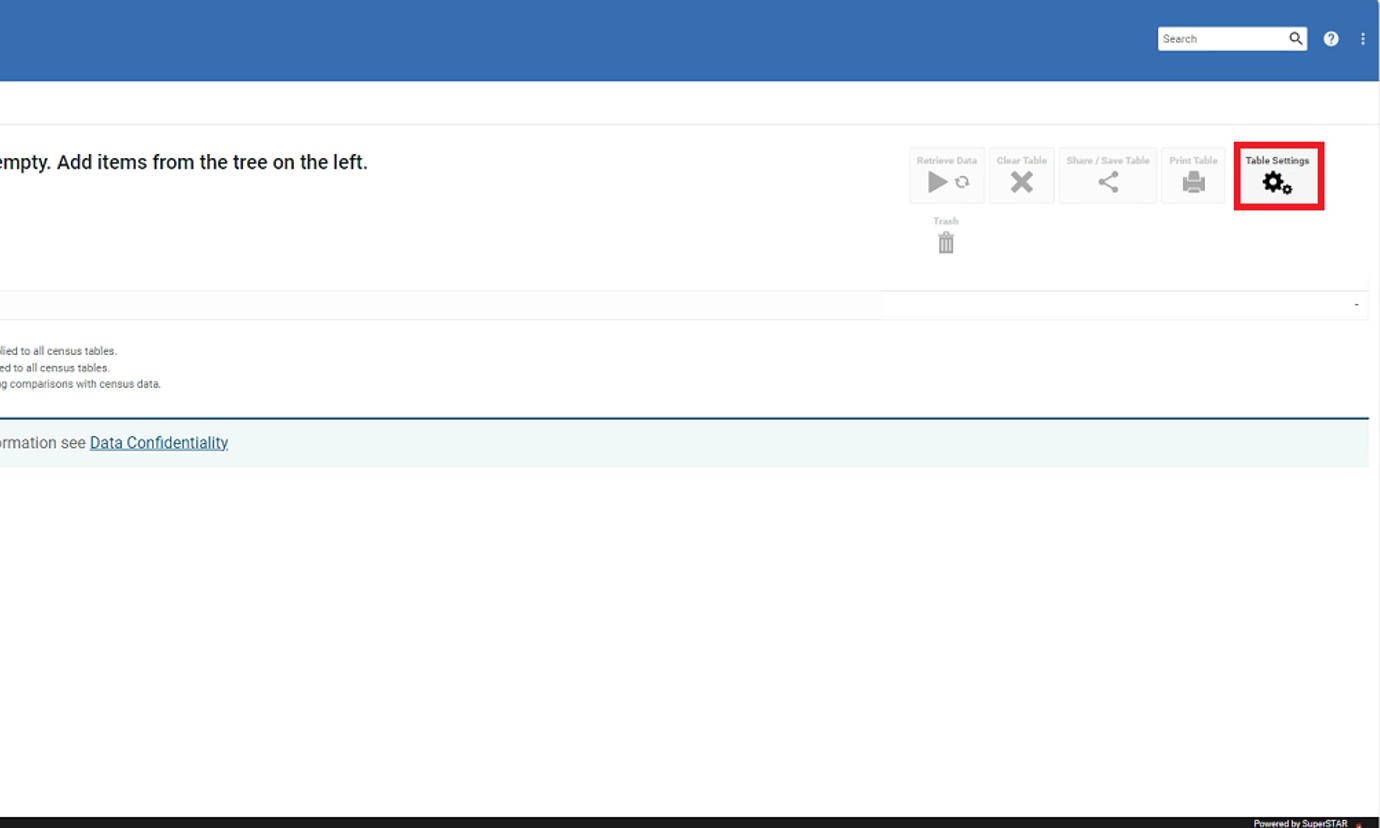
Trash – this button allows you to delete your table.
Saving and sharing tables
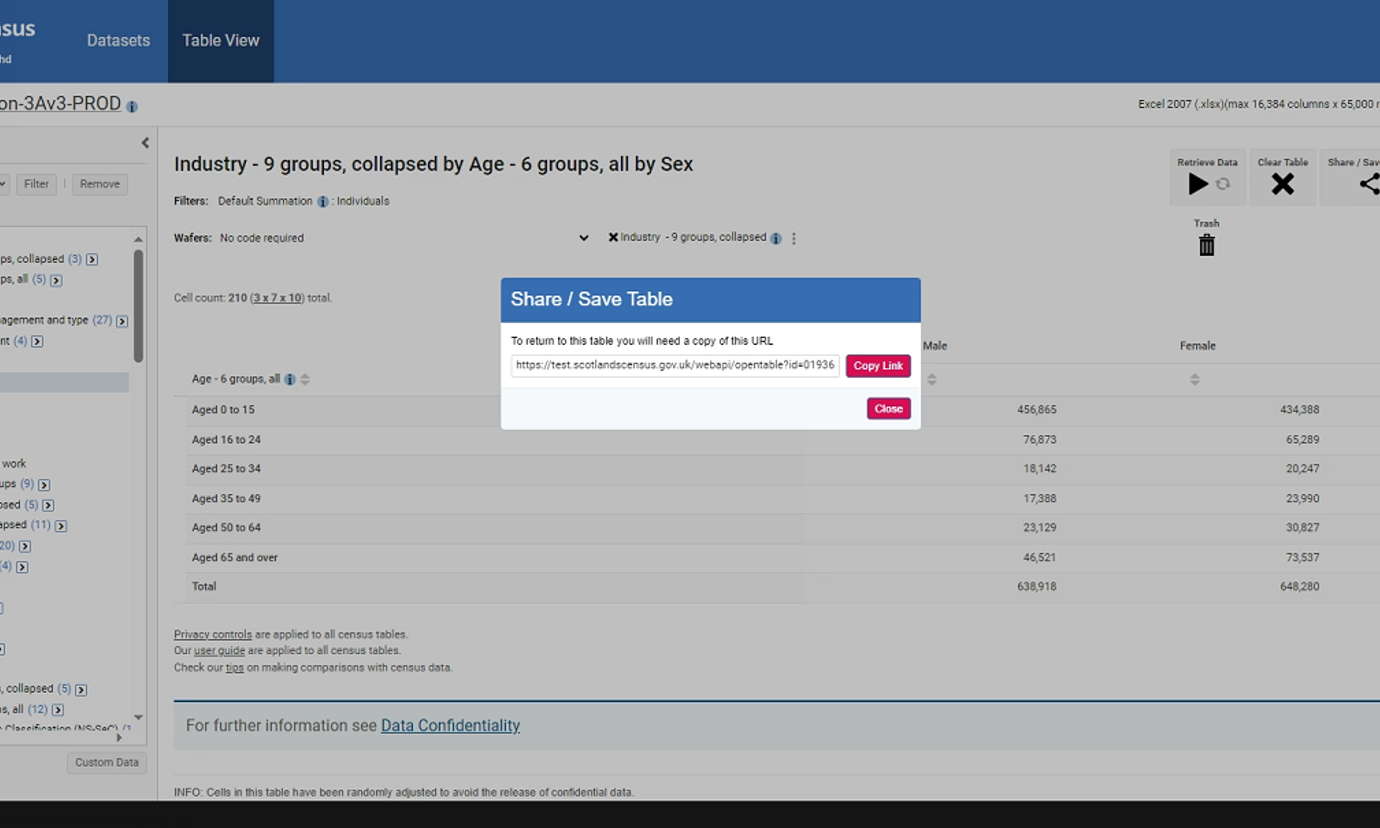
Users can save a table to share it with a colleague or access it again easily in future.
This can be done with the Share / Save Table button.
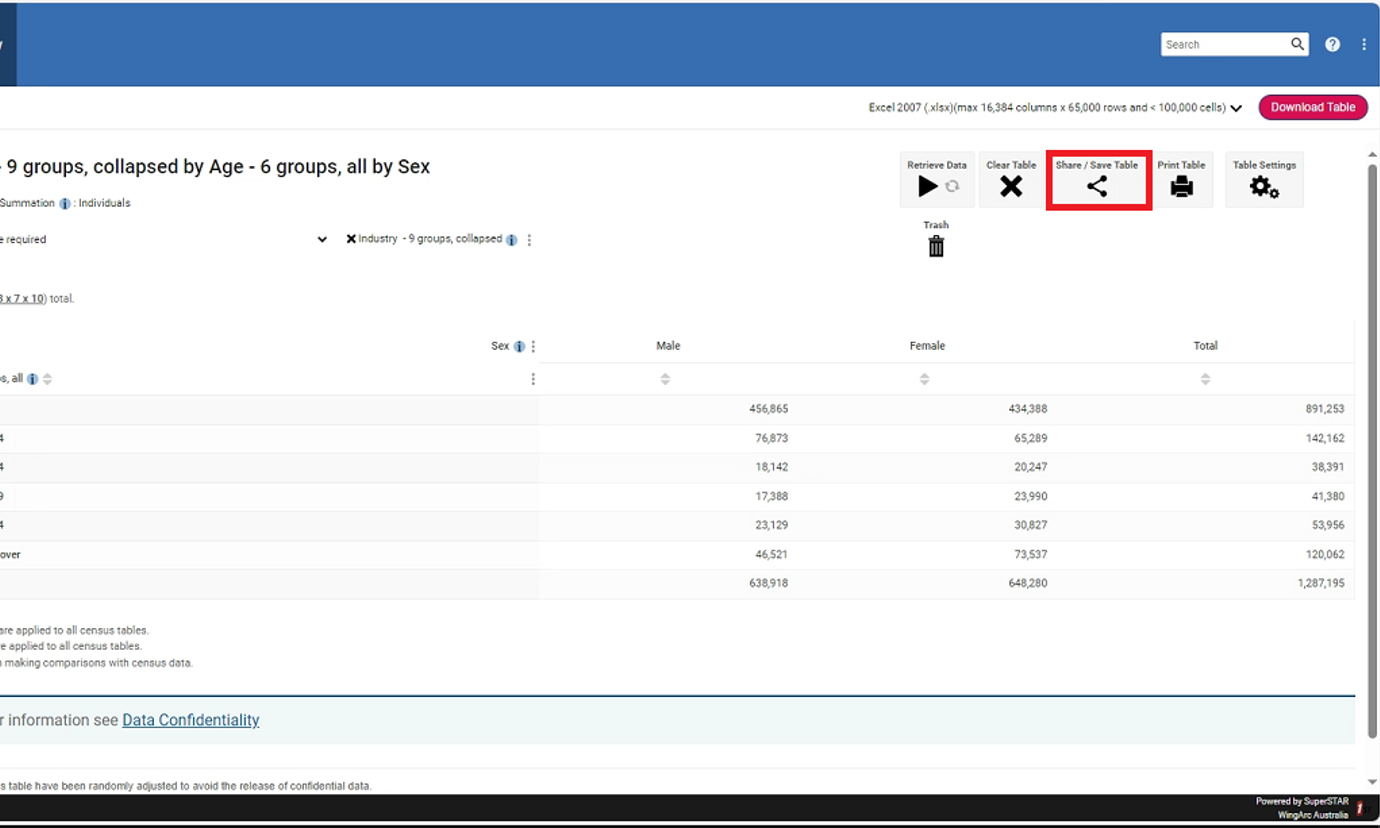
The button creates a link to your table that you can share with colleagues. You could also save the link to a text document, spreadsheet, etc. for future use.
To bookmark a table, you need to first create a dummy bookmark using another webpage. Then replace the dummy URL / webpage address with your table link.
Download data
Once you have added at least one variable or geography to the table builder, a dropdown will appear with various formats in which you can download your table. You can download your table by following the steps detailed bellow:
- Build your table
- Select your preferred format from the options available
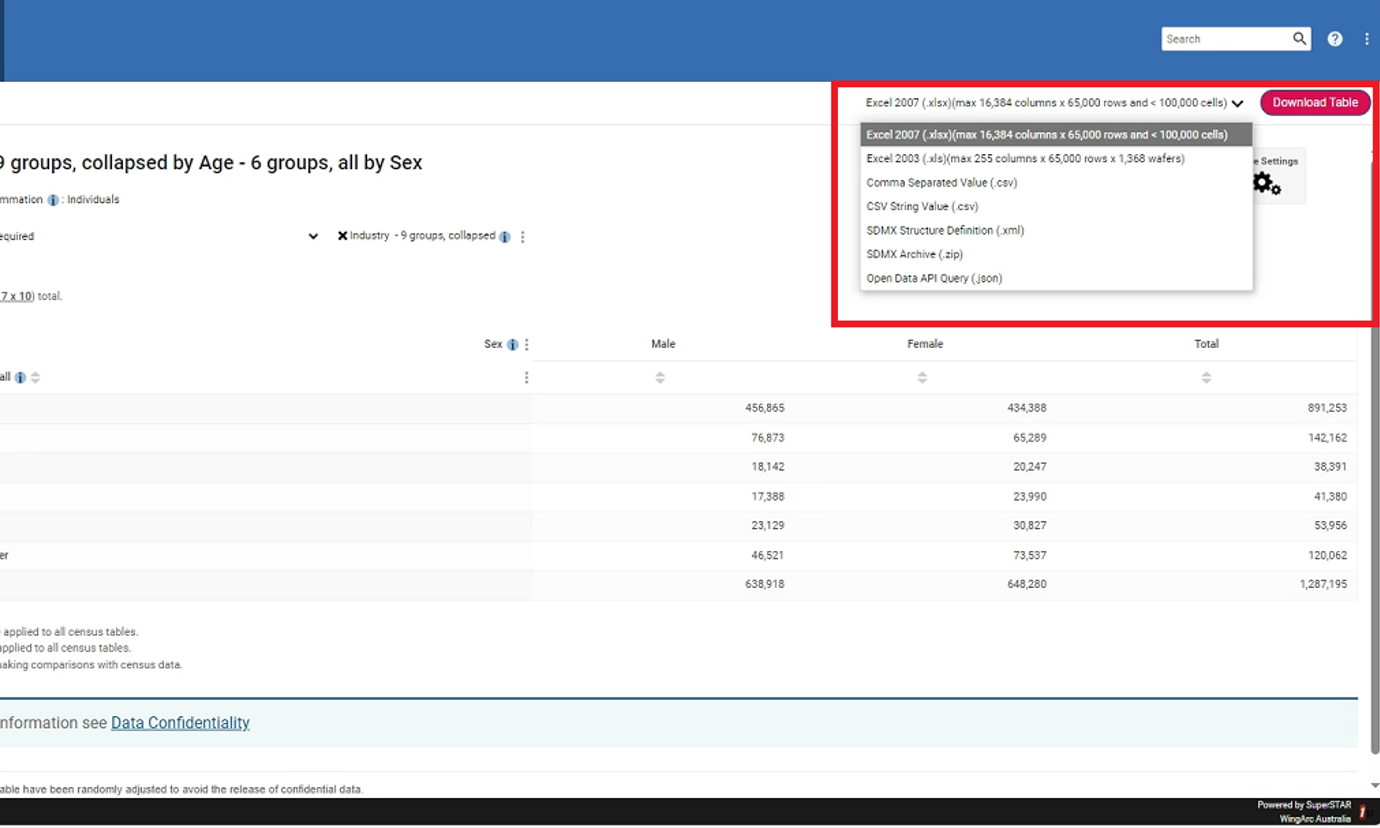
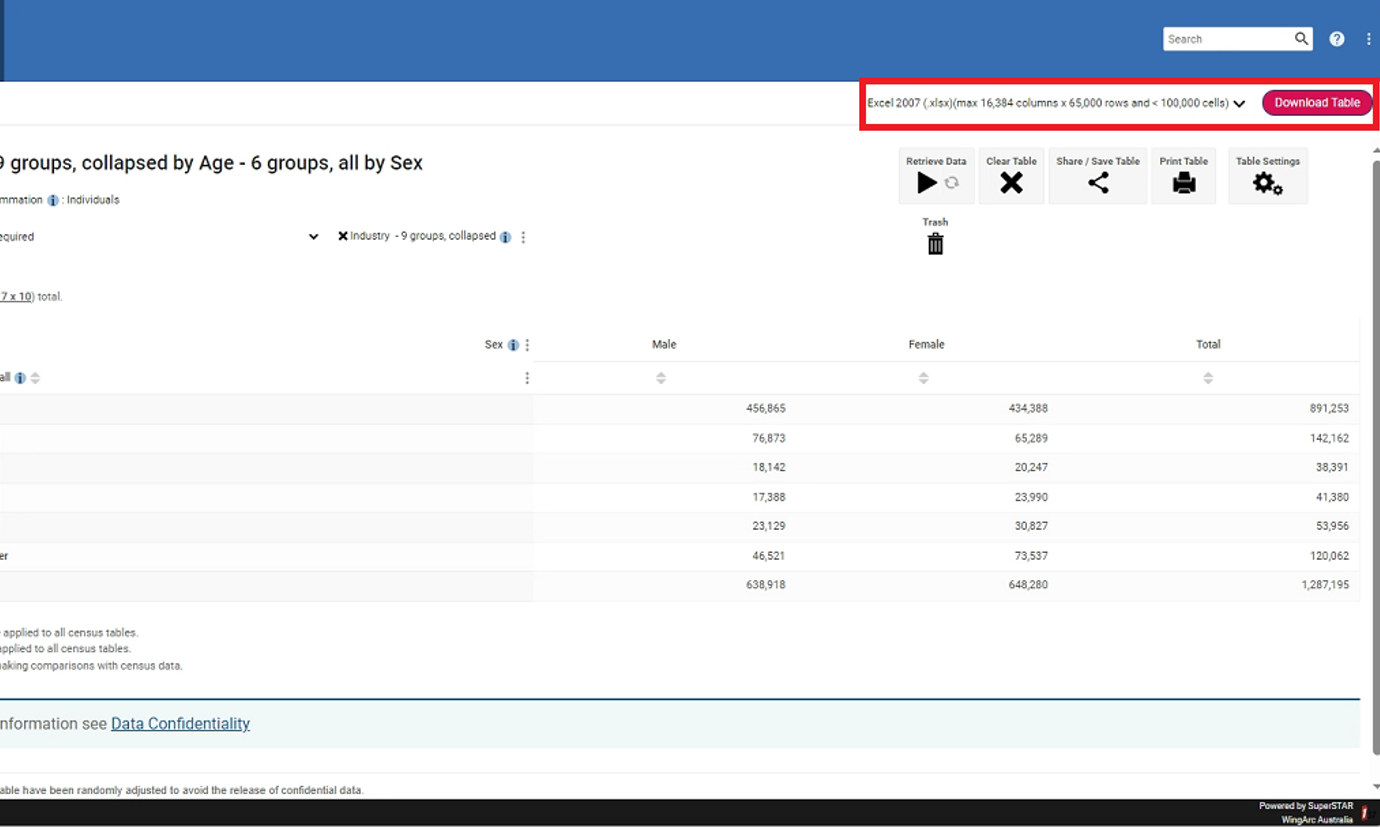
3. Click on the Download Table button
Percentages
In this tutorial we will be examining how to use table settings to change our data being displayed as counts of people, to being displayed as percentages. To accomplish this, we will be using the Council area and Age (5 classifications) variables from the person dataset and examining the percentage of people in each age classification for each council area.
Once you have selected the person dataset and opened the table manager, drag the Council area variable into row.

Drag age into column.
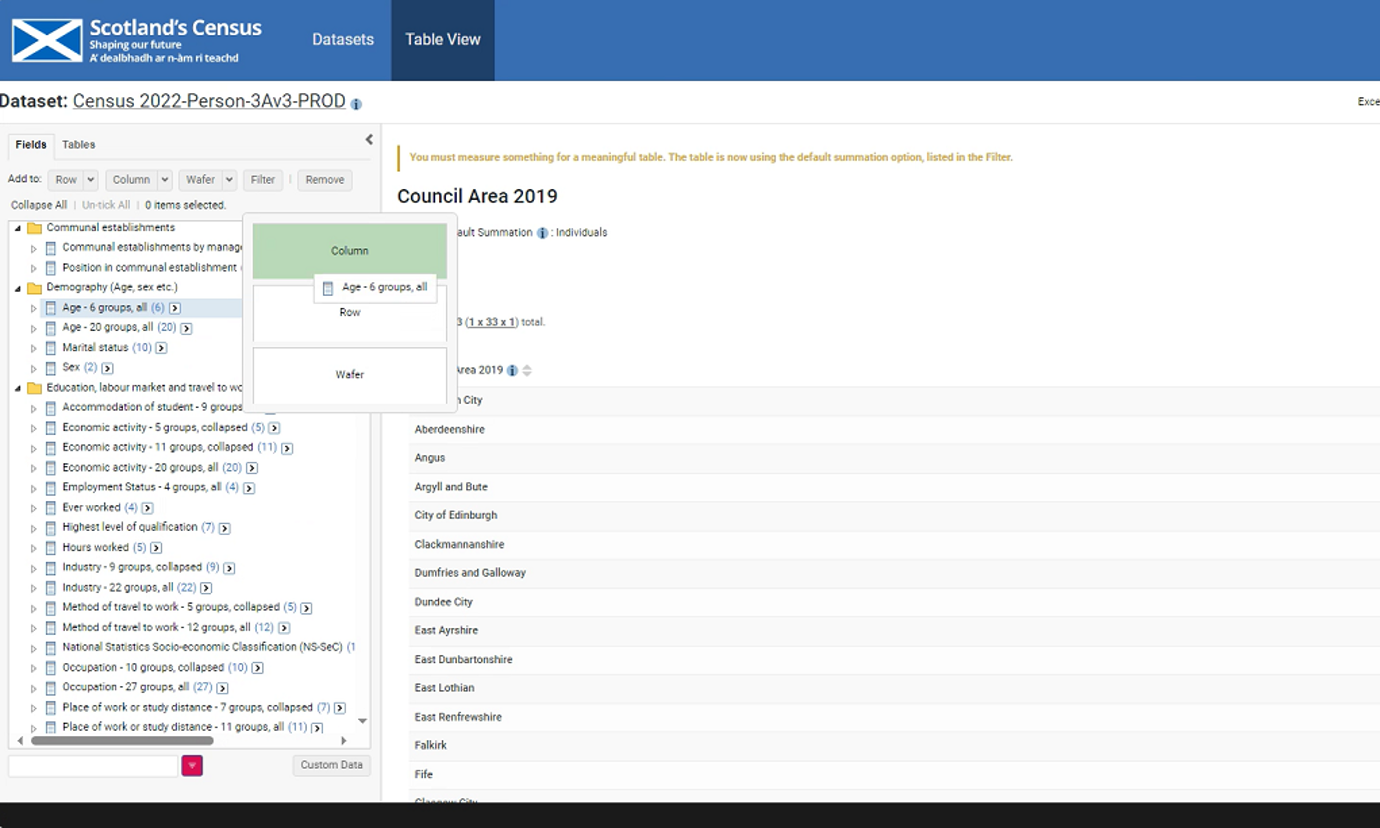
You can now populate your table by clicking the retrieve data button in the table manager
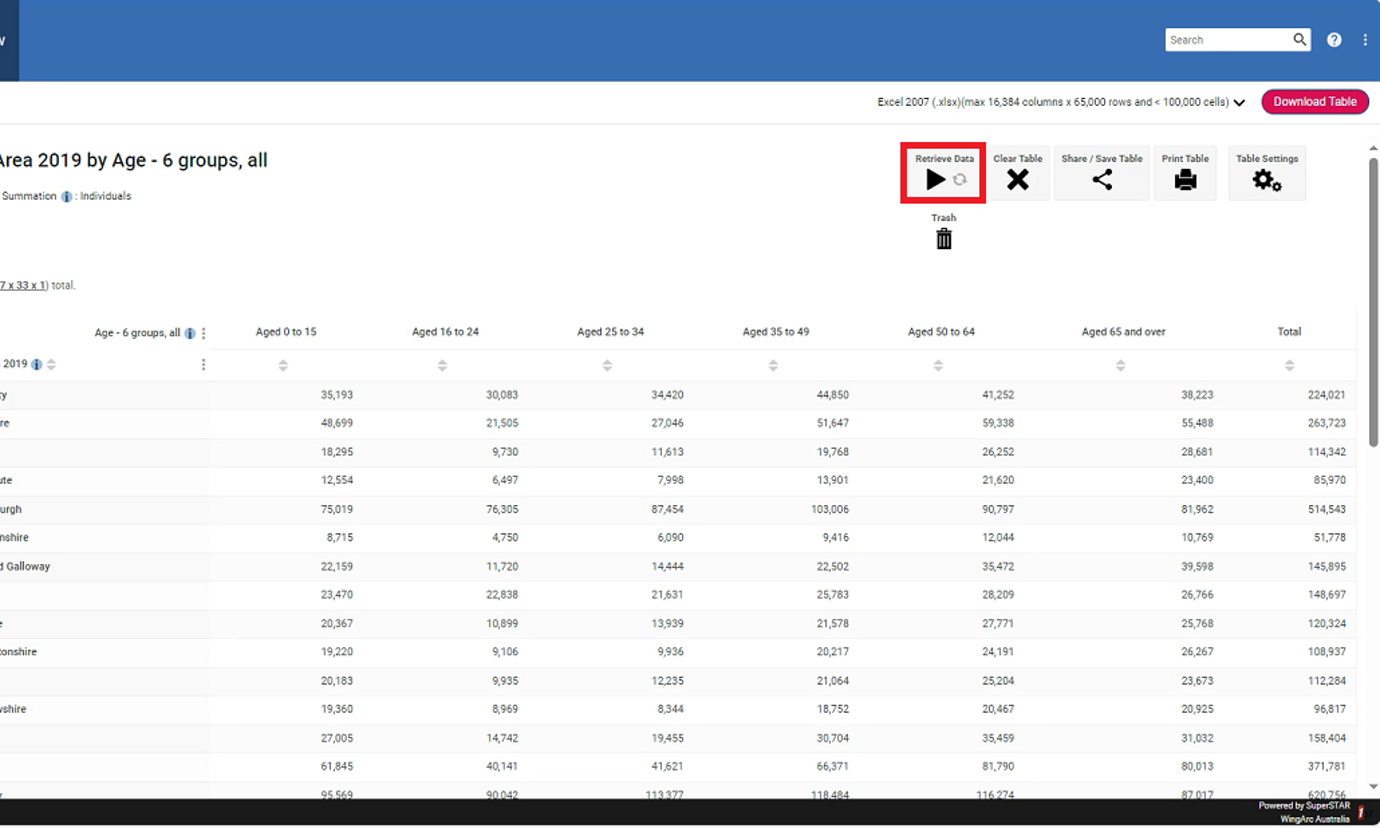
To get the percentage of people in each age classification for each council area we want to select the table settings button in the table manager, then select display as percentages and finally select row as we have council areas set to row
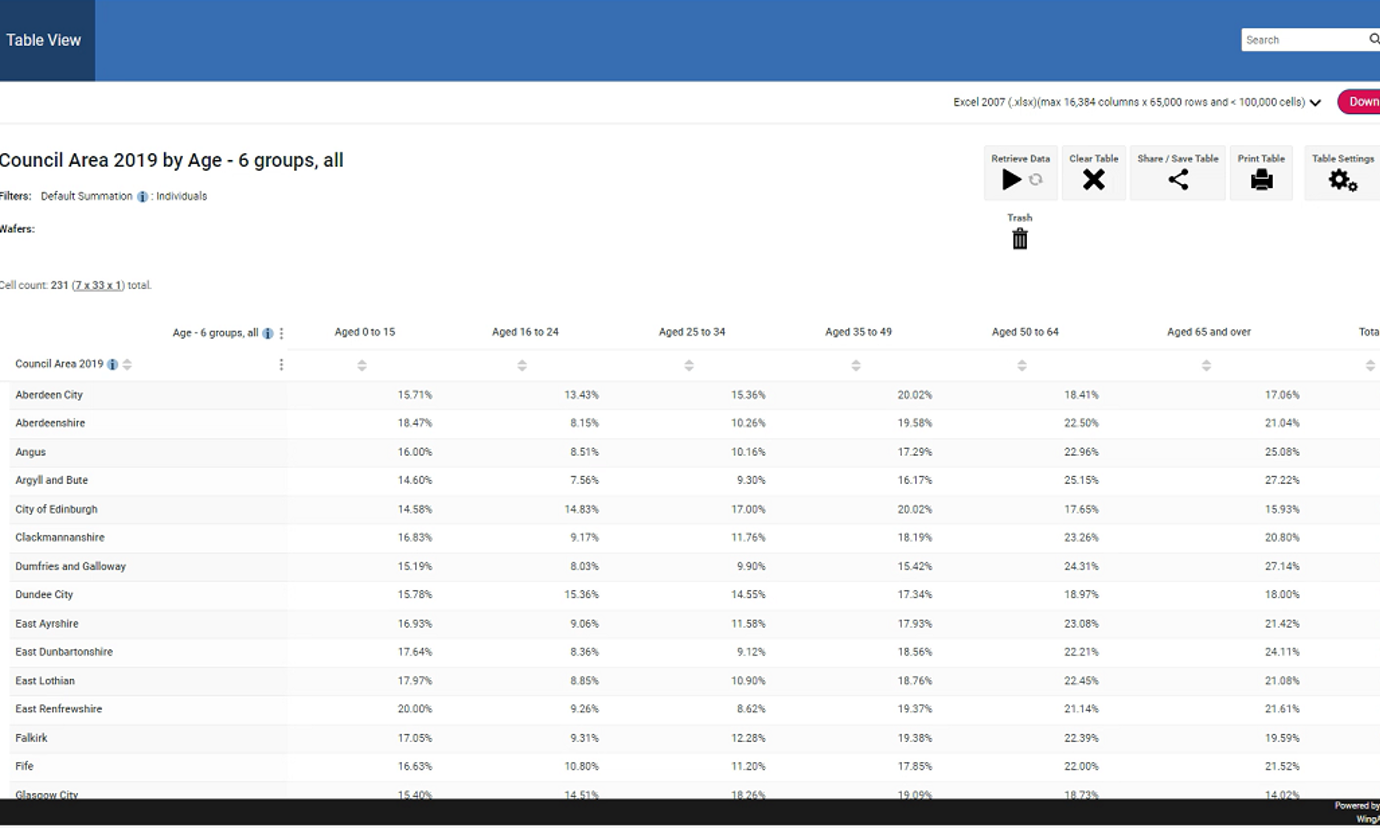
The table should now be displaying the data as the relevant percentages
This process can be copied with any different combinations of up to 4 variables, as well as with combinations of 2 or 3 variables.
I am unable to build the table I want
Due to the requirement of protecting census participants’ data and the duty to ensure individuals and households cannot be identified through Census data, users will not be able to build certain tables. This will either be because a certain combination of variables has been identified as risky and is prohibited, or because the table a user is trying to build exceeds the maximum allowed cell count (61,640 cells). In these situations, we recommend following the steps detailed bellow:
- Check if the variables you are interested in have less detailed alternatives available (for example, instead of using the Industry – 22 groups variable with Ethnic group – 21 groups variable, using the Industry – 9 groups variable with the Ethnic group – 8 groups variable)
- Explore whether using less variables in combination provides you the data you are interested in.
- Evaluate whether observing the combination of variables you are interested in at a less detailed geography is suitable for your needs
- Fill in a special request to be given access to the data if less detailed combinations do not work/fulfil your needs
Custom geographies
The table builder comes with several preset geographies of varying sizes, which can be further customised by users to suit their requirements. To demonstrate this, we will be building a custom geography of Electoral Wards contained within the City of Edinburgh local authority.
- Open the person dataset, navigate down to the geographies folder and open the Electoral Ward 2022 variable
- Select all the relevant Electoral Wards
- Click add to Row to add them as a row in our table (you can add them as either a row, column or wafer)
- Save this custom geography by using the share table feature. This will create a link to this table, through which you can access this custom geography again in future without having to repeat steps 1 to 3.
Removing rows or columns with only zeroes
When working with smaller geographies and large variables, instances may occur where columns or rows contain only zeroes. In such instances, the table manager has a feature to remove these instances from your table.
- Click on the table settings button within the table manager.
- Select Remove rows and columns containing zeroes
- Select either Rows or Columns
Automatically retrieve data
While building tables, the user has the option to set the retrieve data button to automatically retrieve data for variables as they are added to the table. This can be accomplished by following the steps provided below:
- Select the first variable you wish to include ion your table and add it to the flexible table builder
- Click the “Toggle Automatically Retrieving Data” part of the retrieve data button. This will mean that your table gets tabulated whenever you add a new variable to it, instead of only when you click the retrieve data button.
- Add your remaining variables
Comparing with previous censuses
The Flexible Table Builder only contains data from the 2022 census. Data from previous censuses can not be added to the Flexible Table Builder. This is due to the Statistical Disclosure Control methods that need to be applied to the data that is published via the Flexible Table Builder. These methods cannot be applied to censuses where tables are already published.
Data from the 2011 and 2001 censuses are available from this website using the search census data section of the website.
Example 1: Table with variables as rows and columns
In this tutorial we will be examining how to build a table that combines variables as rows and columns. As our example we will be building a table that allows us to examine Passport Region by Age by General Health and by Council Area, using data from the person dataset.
To do this:
- Select the person dataset
- Open the table manager
- Drag the Council Area variable into row.

Drag Age into column.
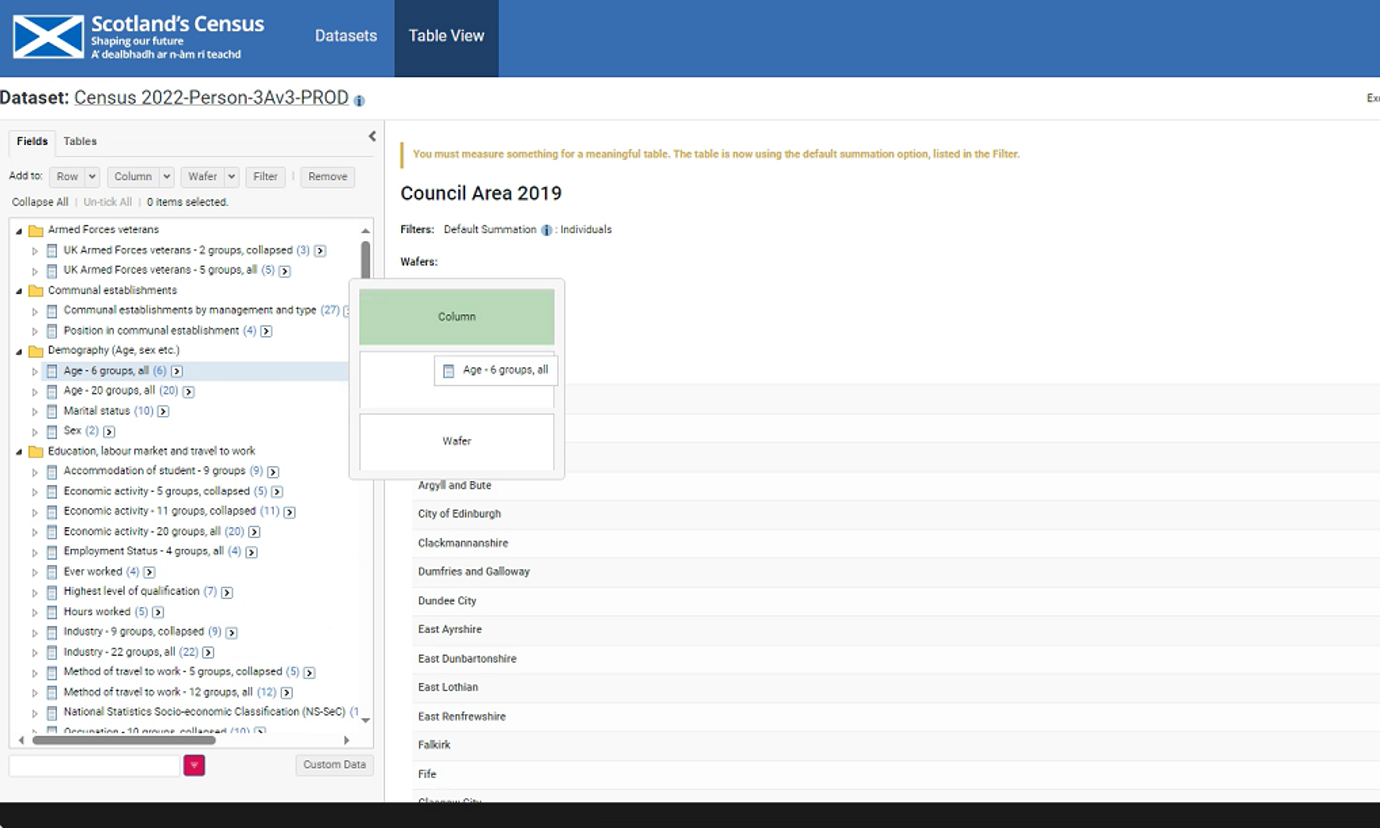
Drag General Health into column.
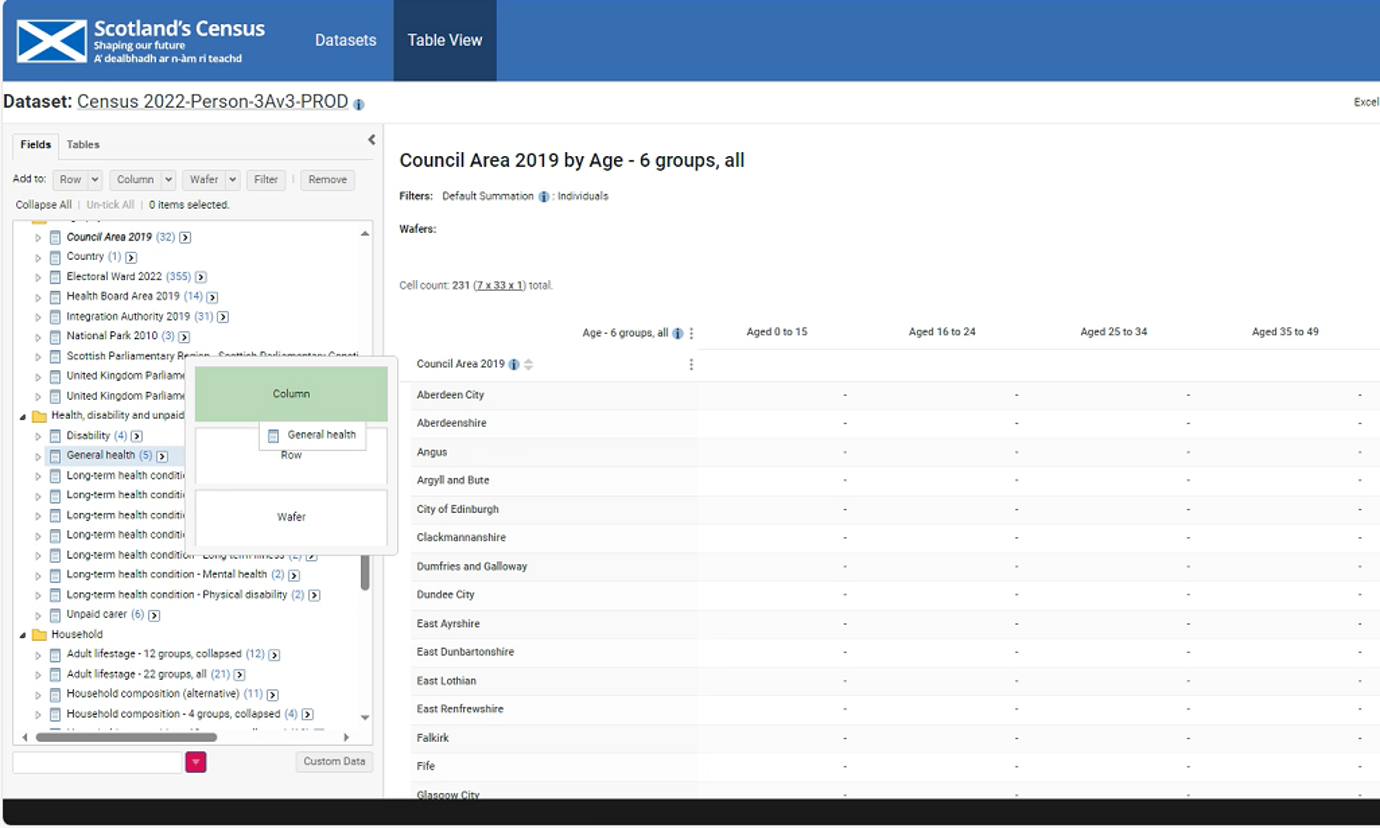
Drag Passport Region into column.
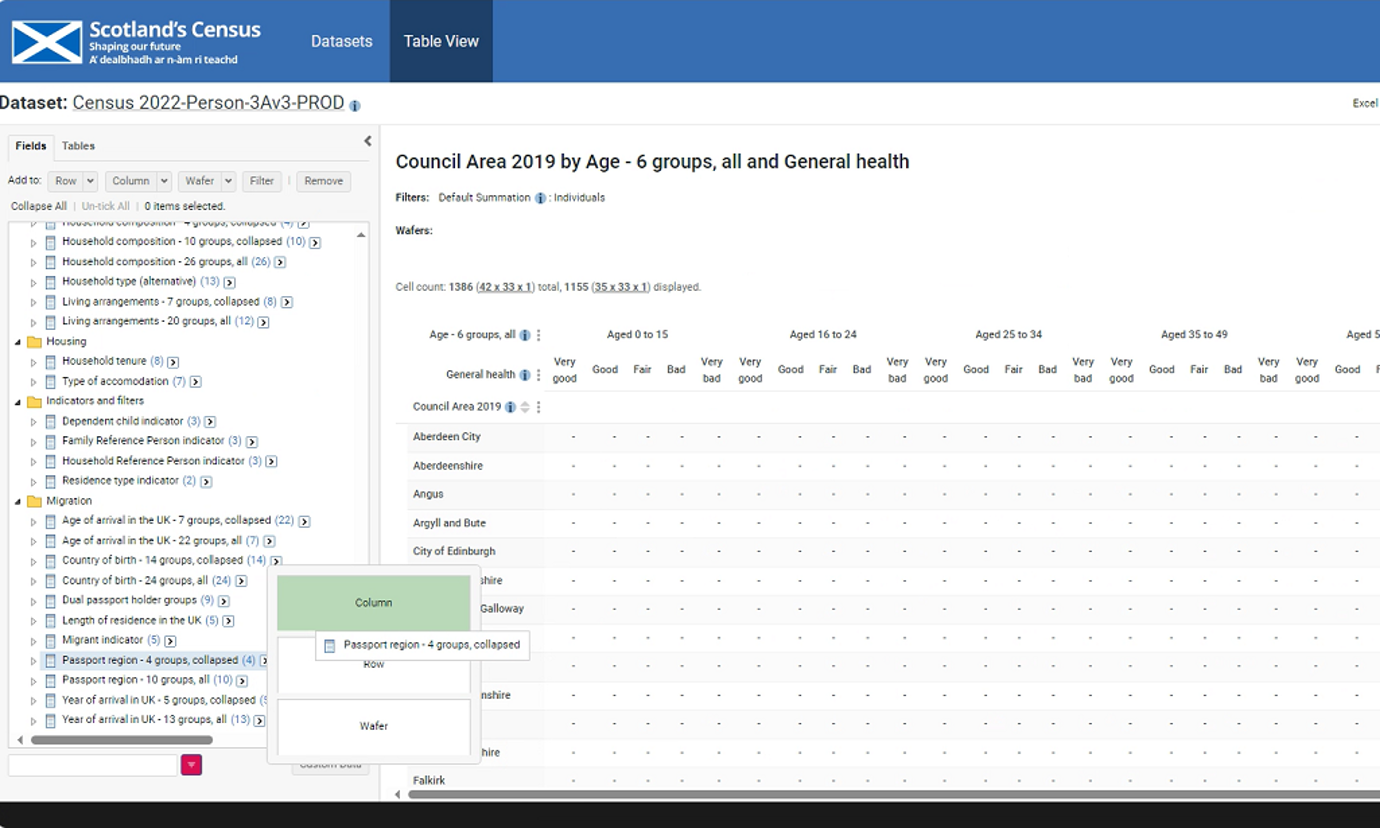
Select the retrieve data button in the table manager to populate the table.
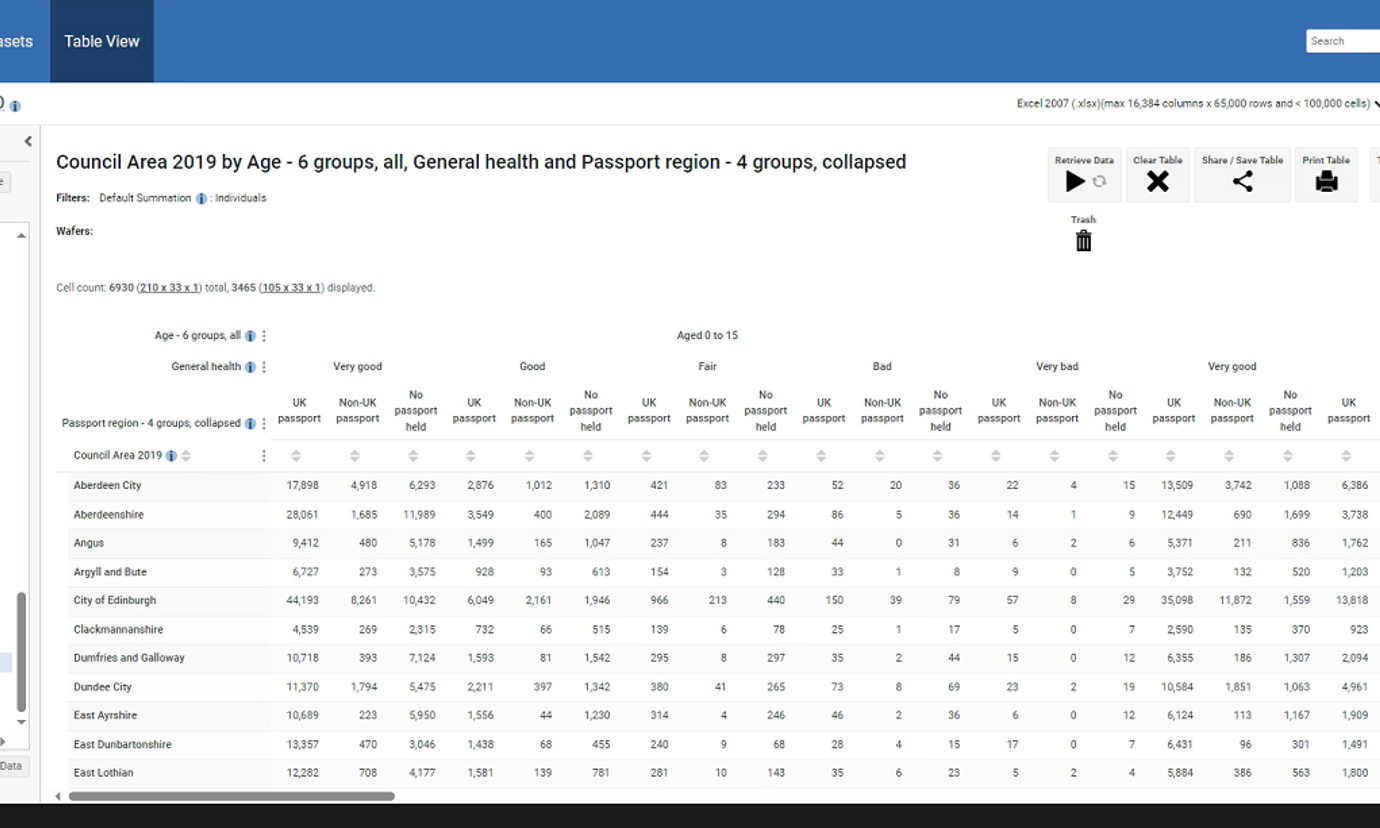
This process can be copied with any different combinations of up to 4 variables, as well as with combinations of 2 or 3 variables.
Example 2: Table with variables as wafer and column
In this tutorial we will be examining how to build a table that combines variables as a wafer and columns. As our example we will be building a table that allows us to examine Passport Region by Age, by General Health and by Council Area, using data from the person dataset.
To do this:
Once you have selected the person dataset and opened the table manager, drag the Council Area variable into wafer.
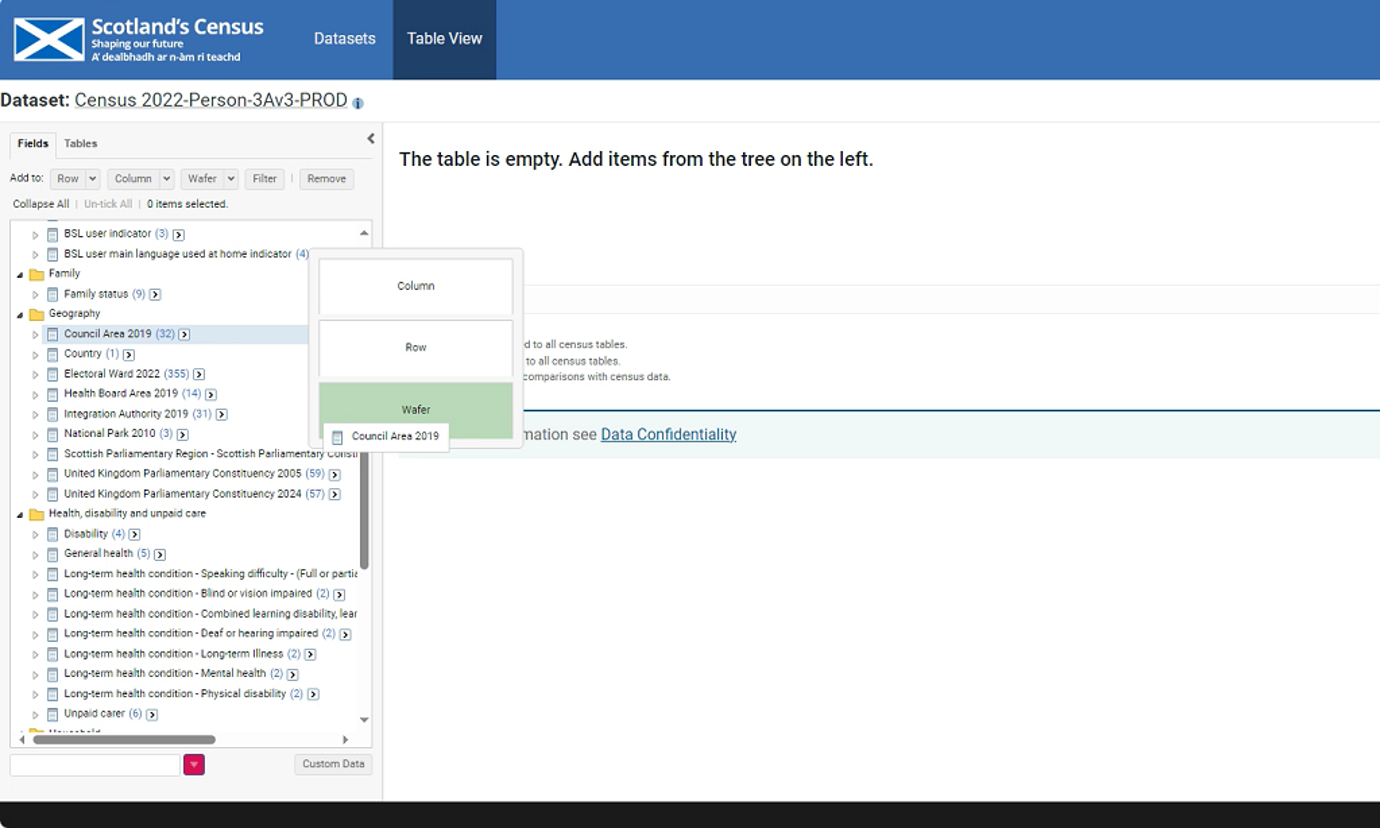
Drag Age into column.

Drag General Health into column.
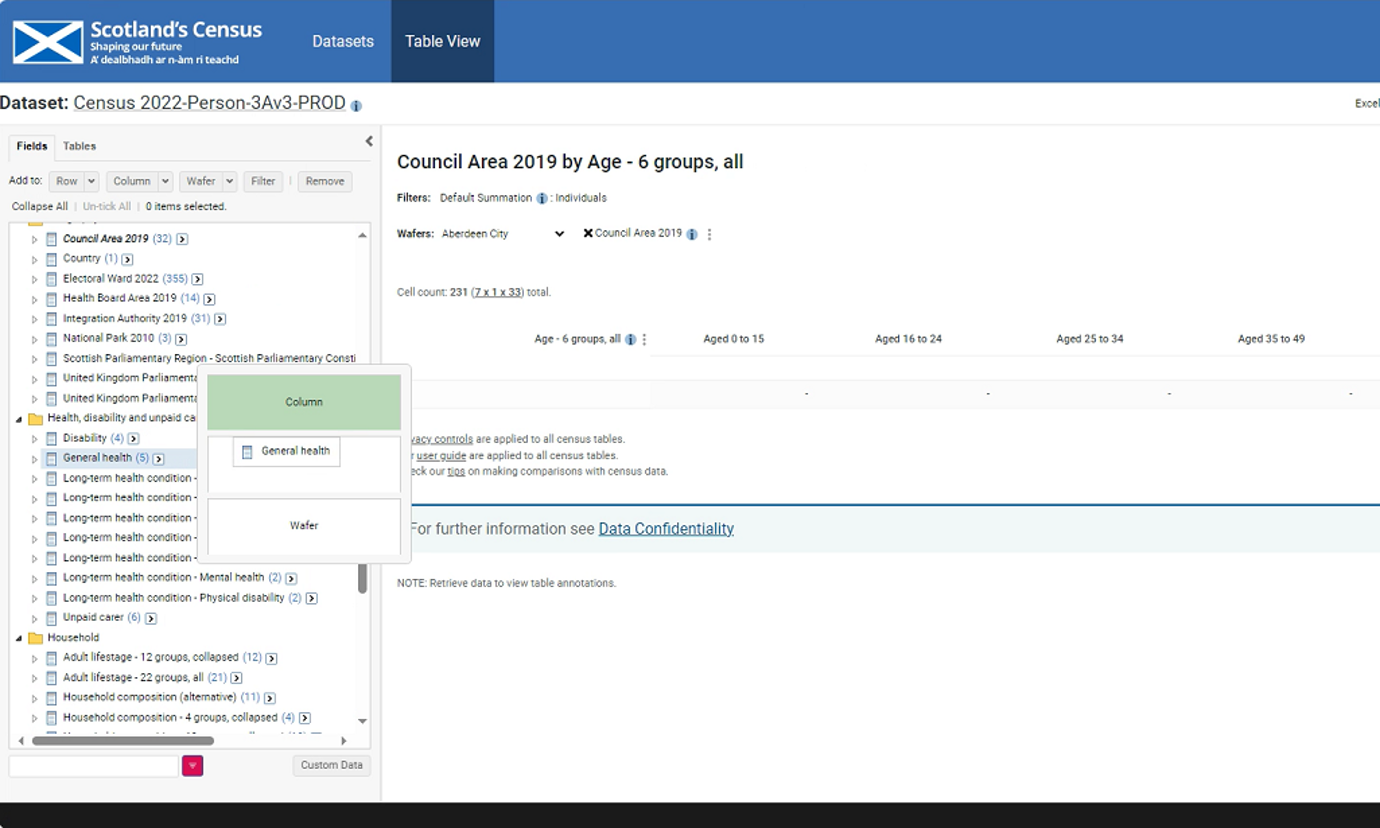
Drag Passport Region into column.
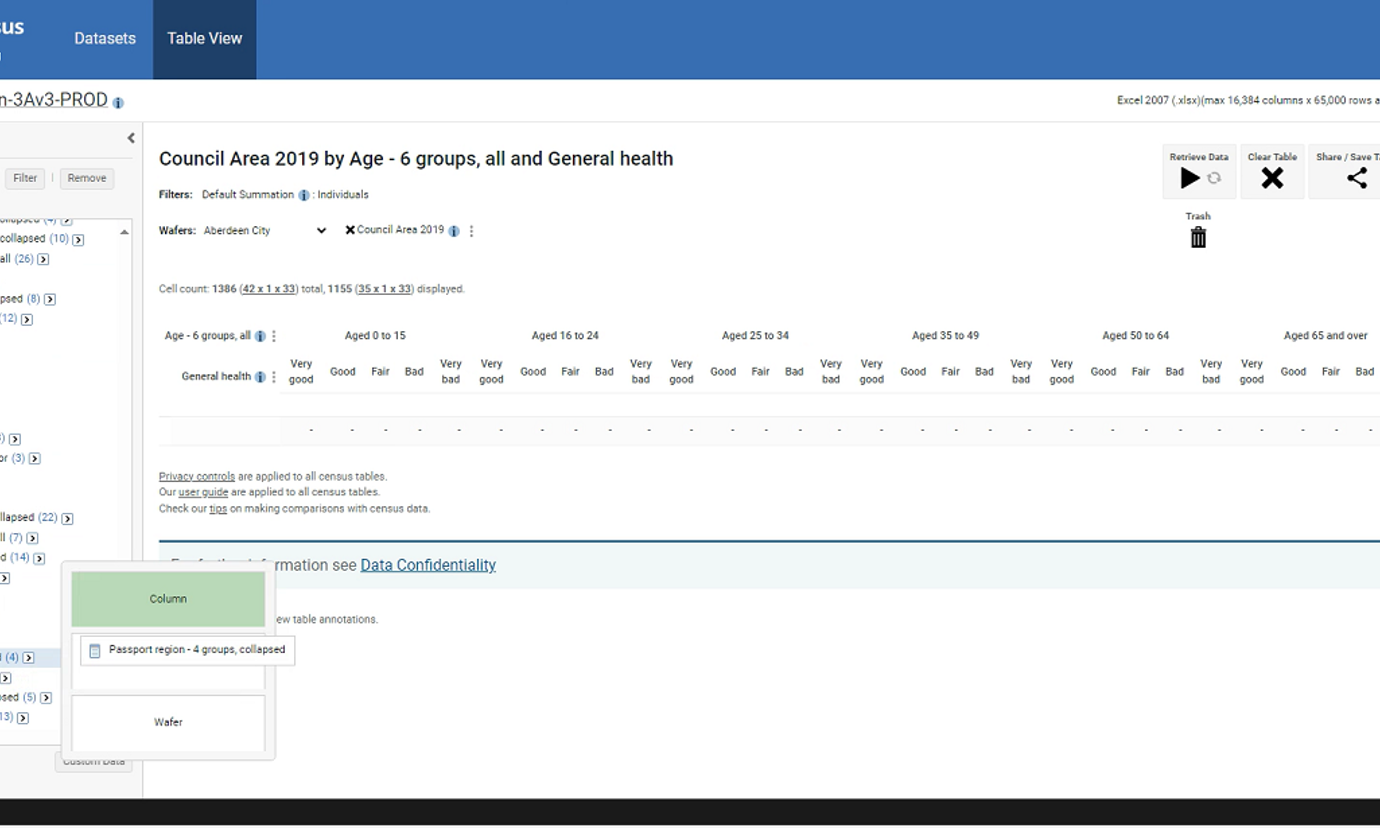
Select the retrieve data button in the table manager to populate the table.
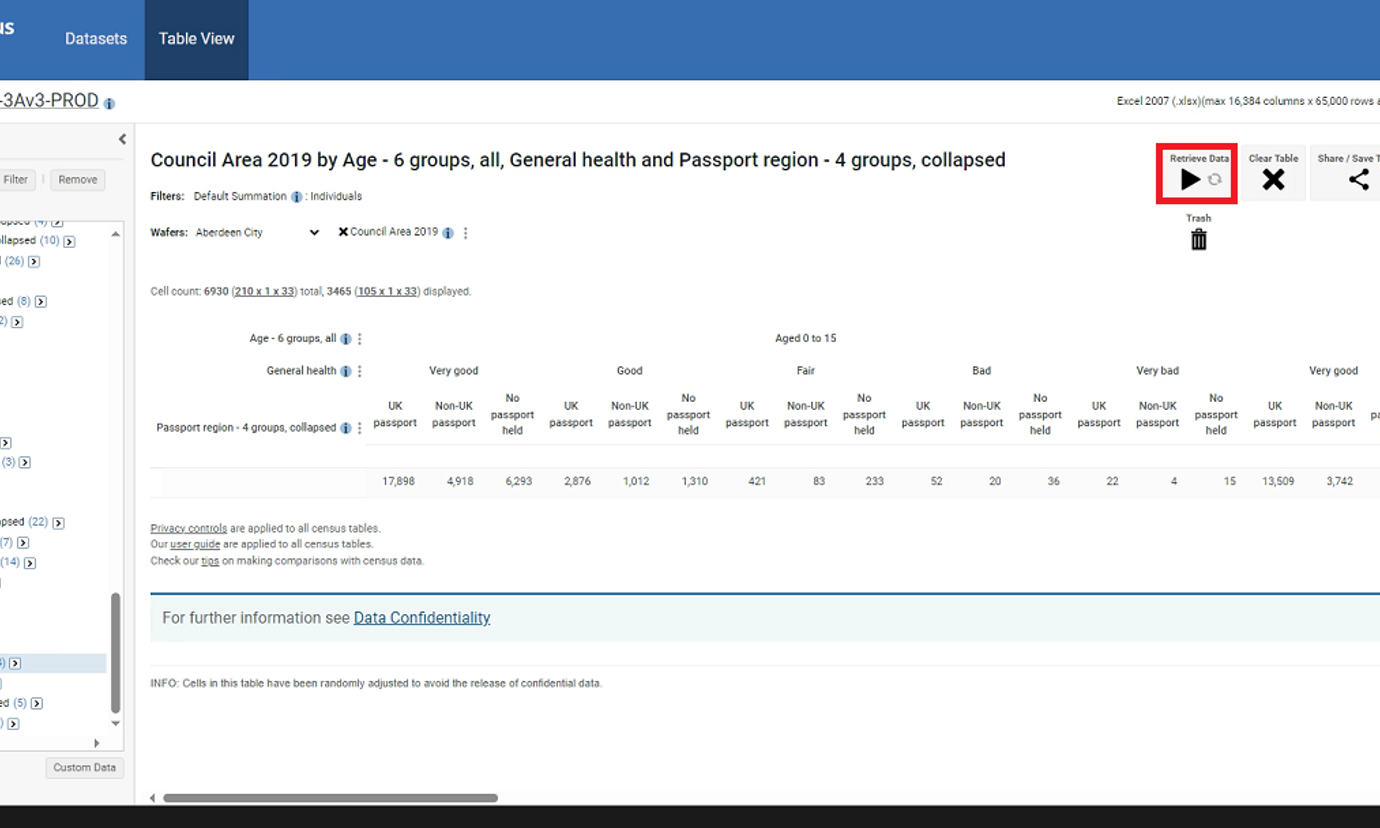
This process can be copied with any different combinations of up to 4 variables, as well as with combinations of 2 or 3 variables.
Example 3: Table that with variables as wafer and row
In this tutorial we will be examining how to build a table that combines variables as a wafer and rows. As our example we will be building a table that allows us to examine Passport Region by Age, by General Health and by Council Area, using data from the person dataset.
Once you have selected the person dataset and opened the table manager, drag the Council Area variable into wafer.

Drag Age into row.
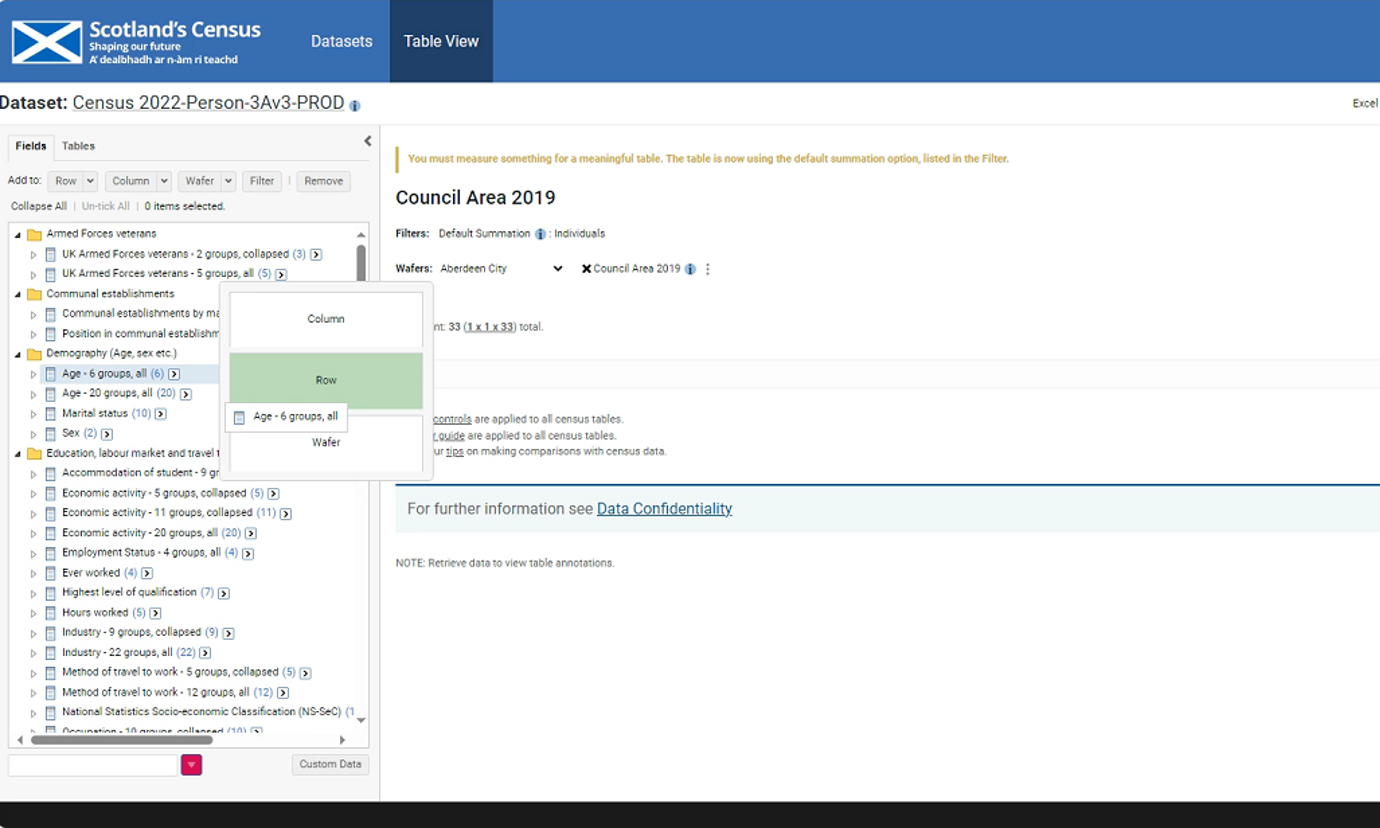
General Health into row.
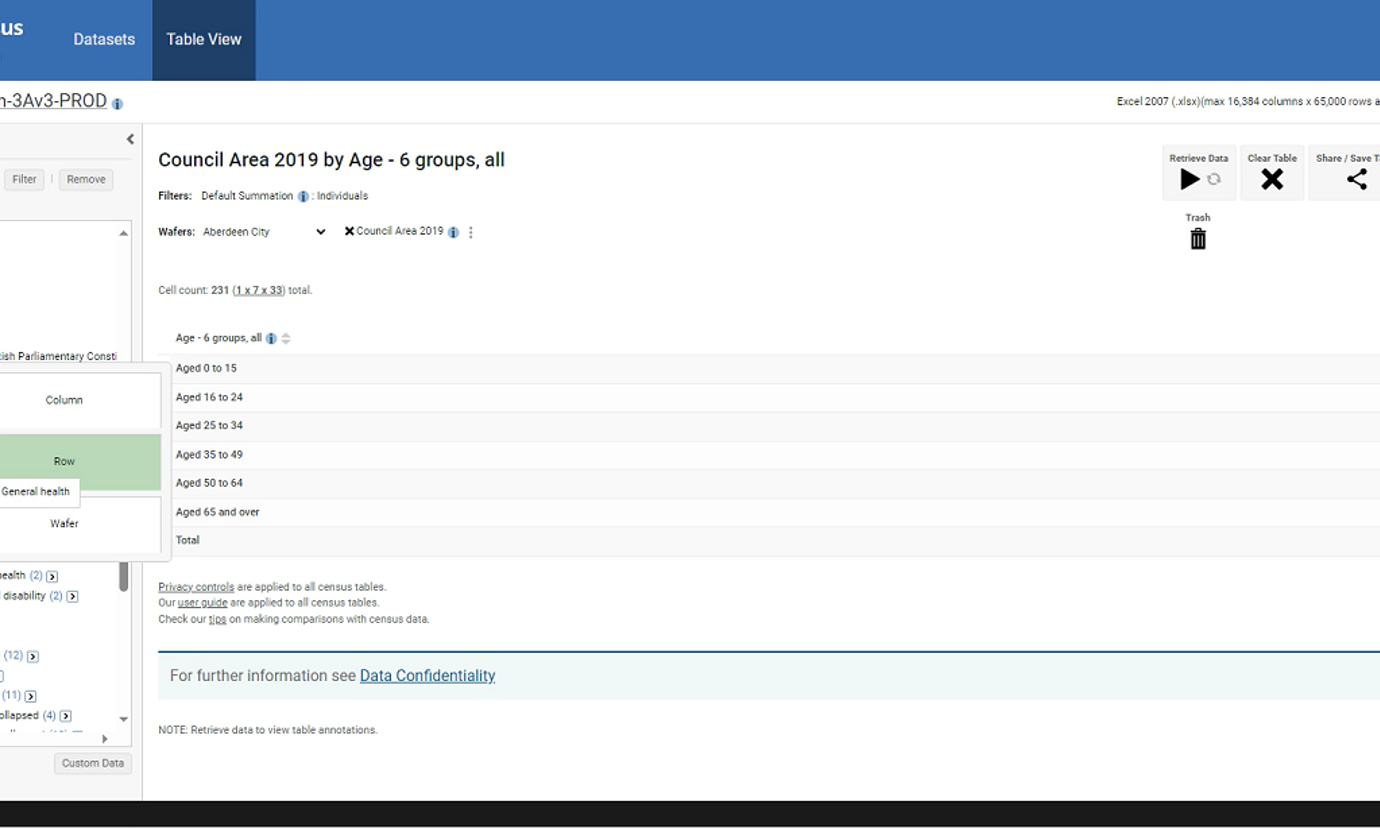
Drag Passport Region into row.
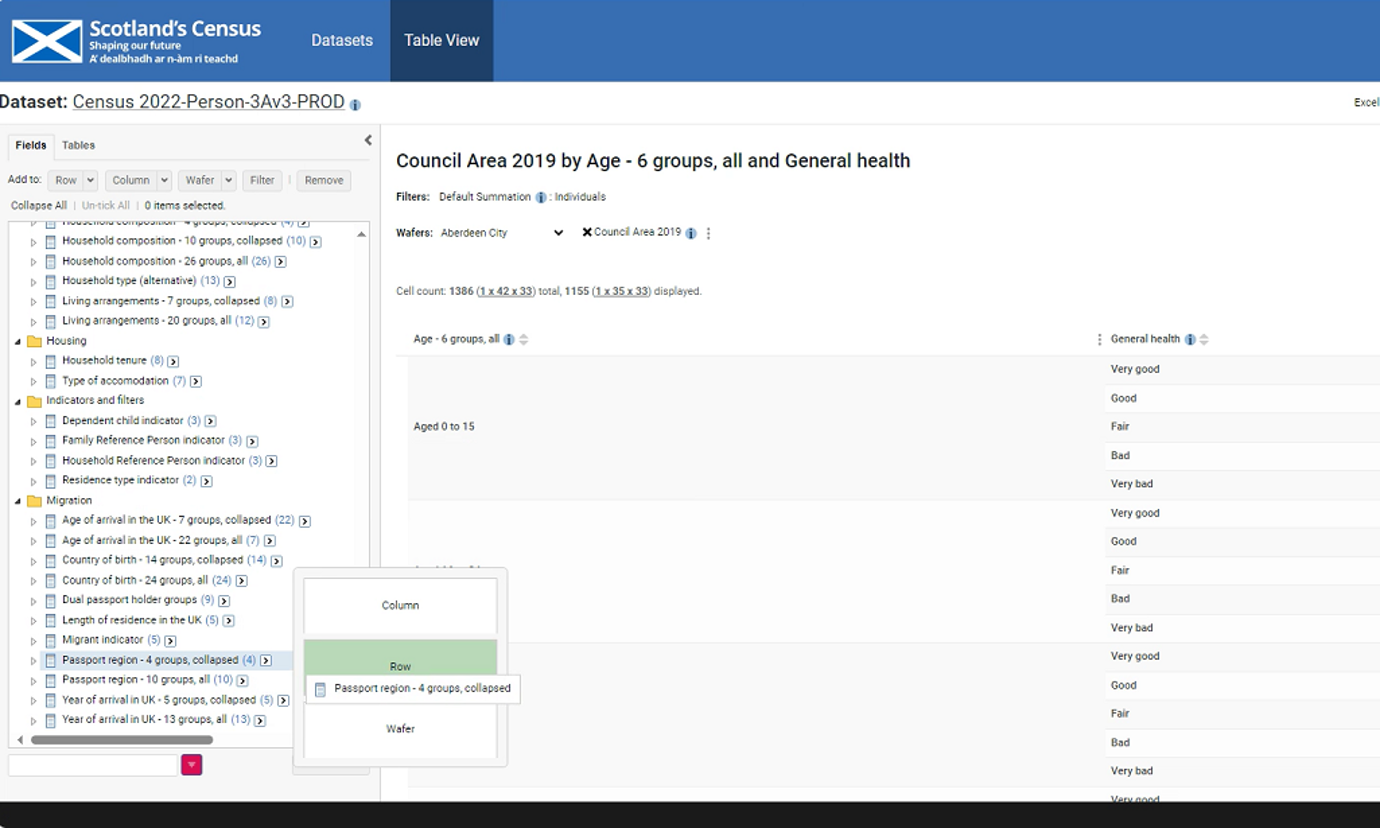
Click the retrieve data button in the table manager to populate the table.
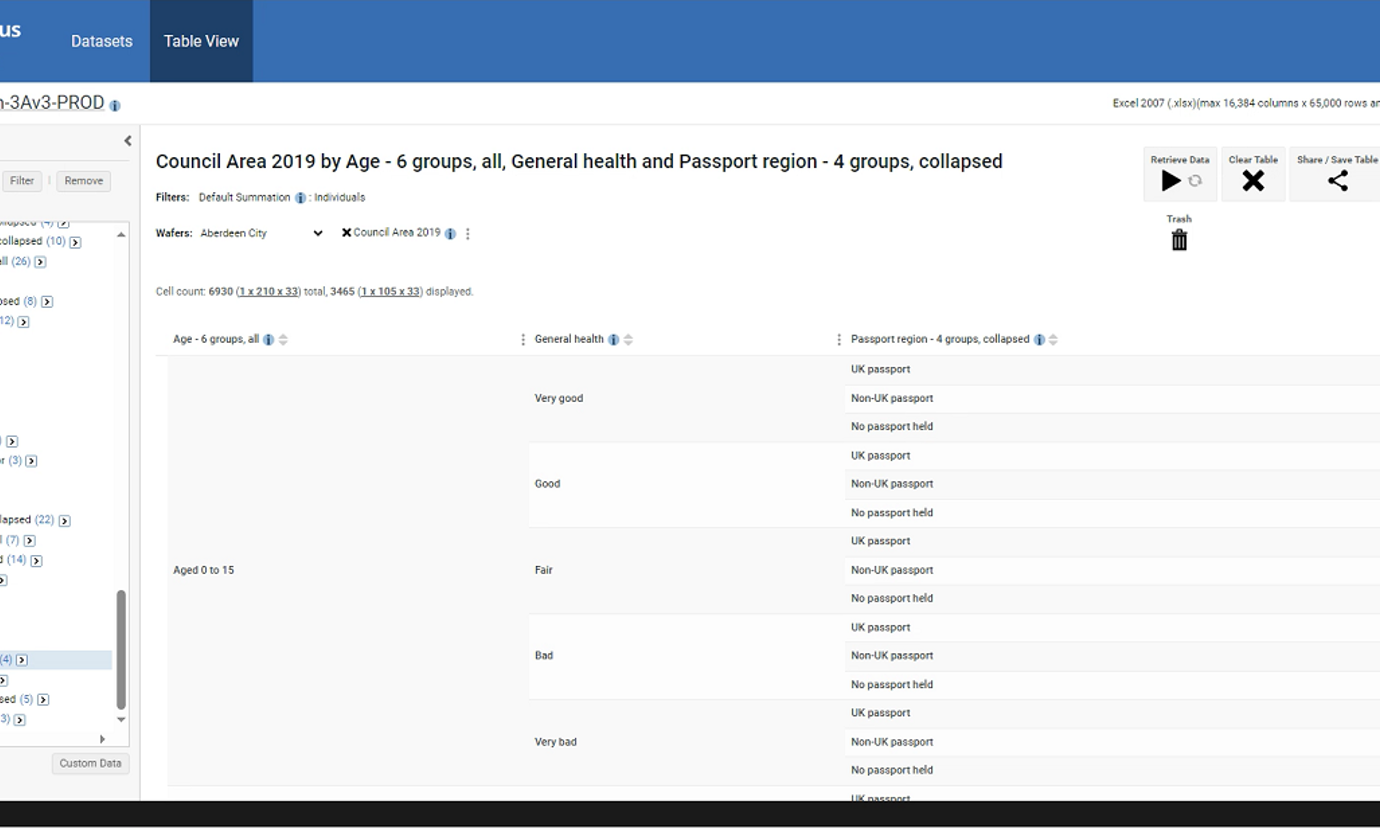
This process can be copied with any different combinations of up to 4 variables, as well as with combinations of 2 or 3 variables.
Example 4: Table with variables as wafer, row and column
In this tutorial we will be examining how to build a table that combines variables as a wafer and rows. As our example we will be building a table that allows us to examine Passport Region by Age, by General Health and by Council Area, using data from the person dataset.
Once you have selected the person dataset and opened the table manager, drag the Council Area variable into wafer.

Drag Age into row.

Drag General Health in column.
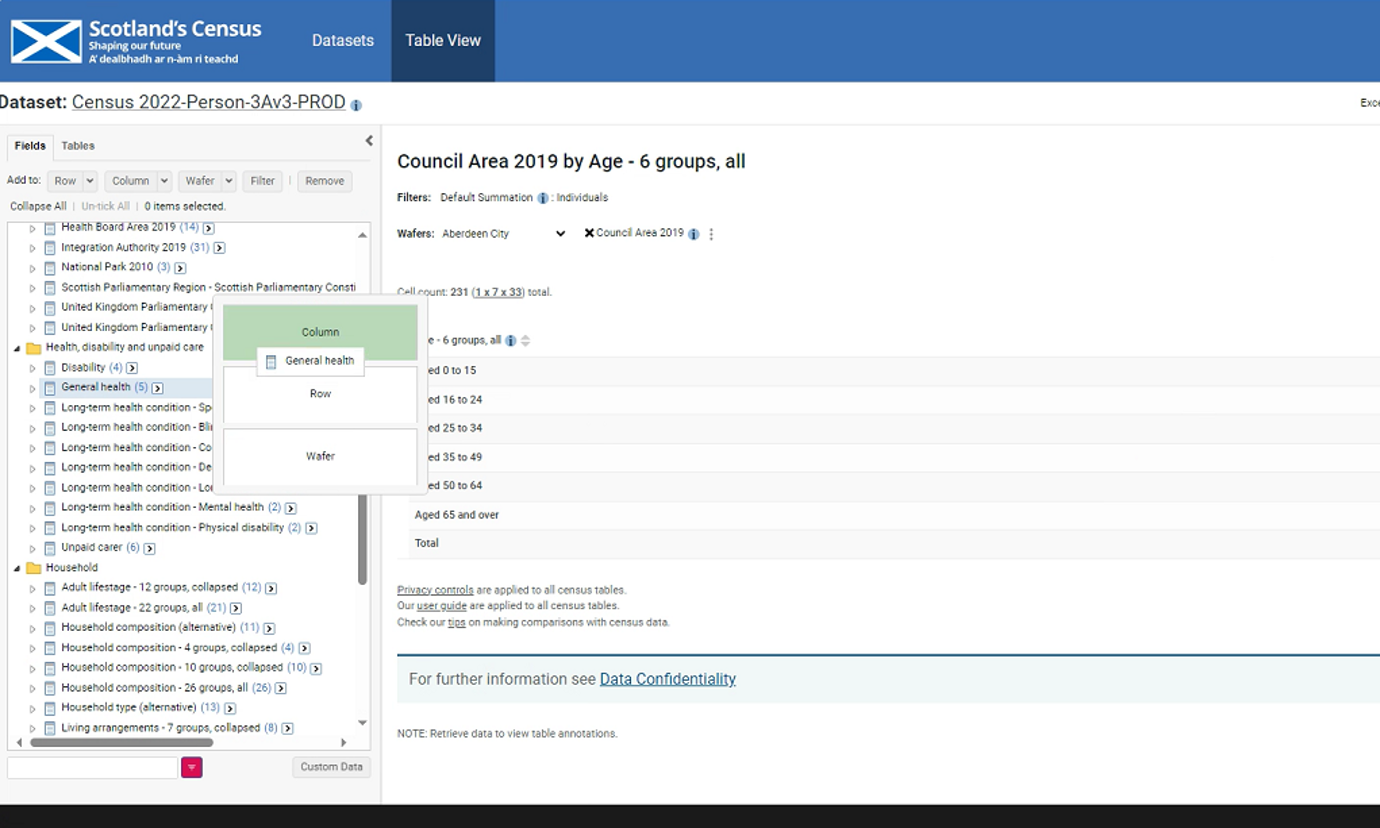
Drag Passport region into column
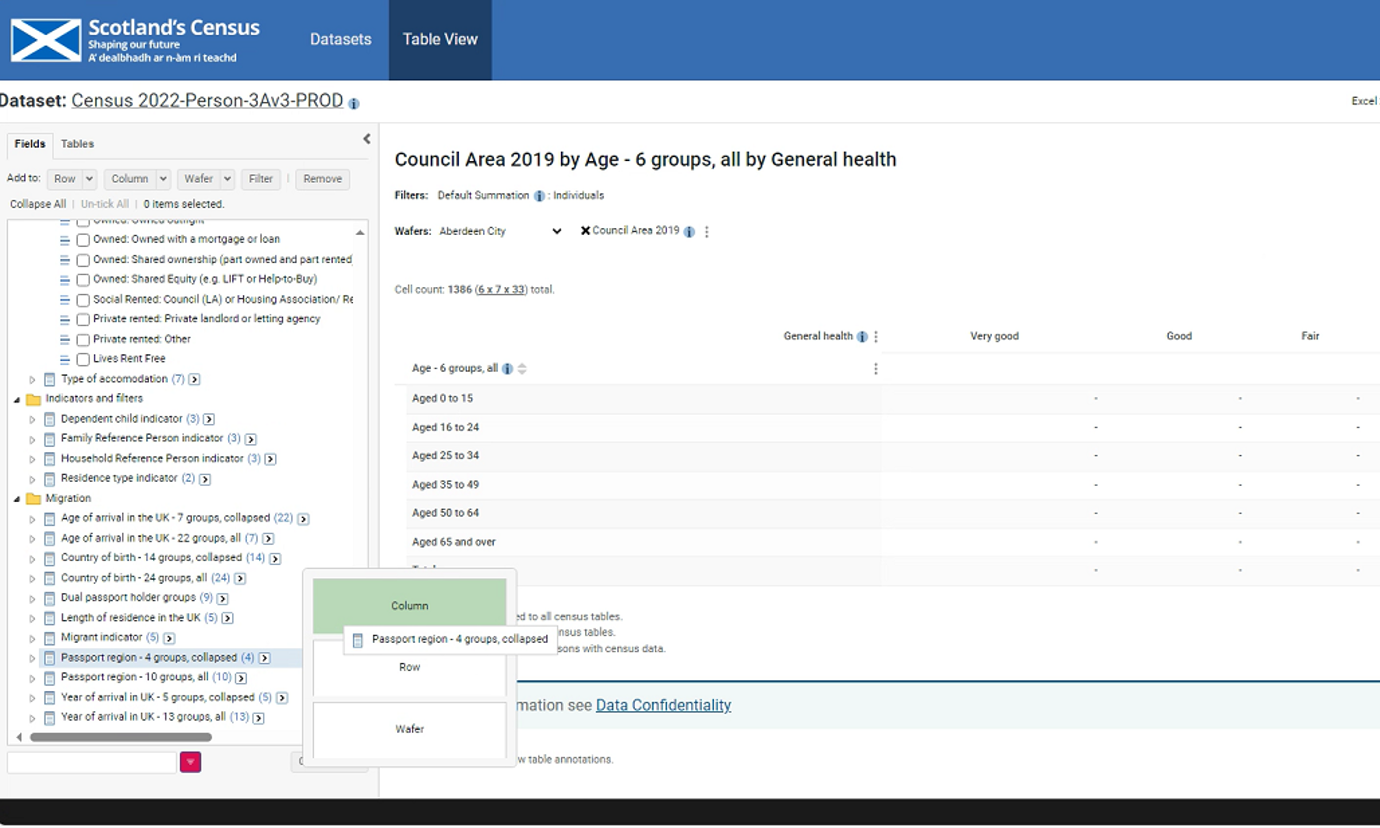
Click the retrieve data button in the table manager to populate the table.
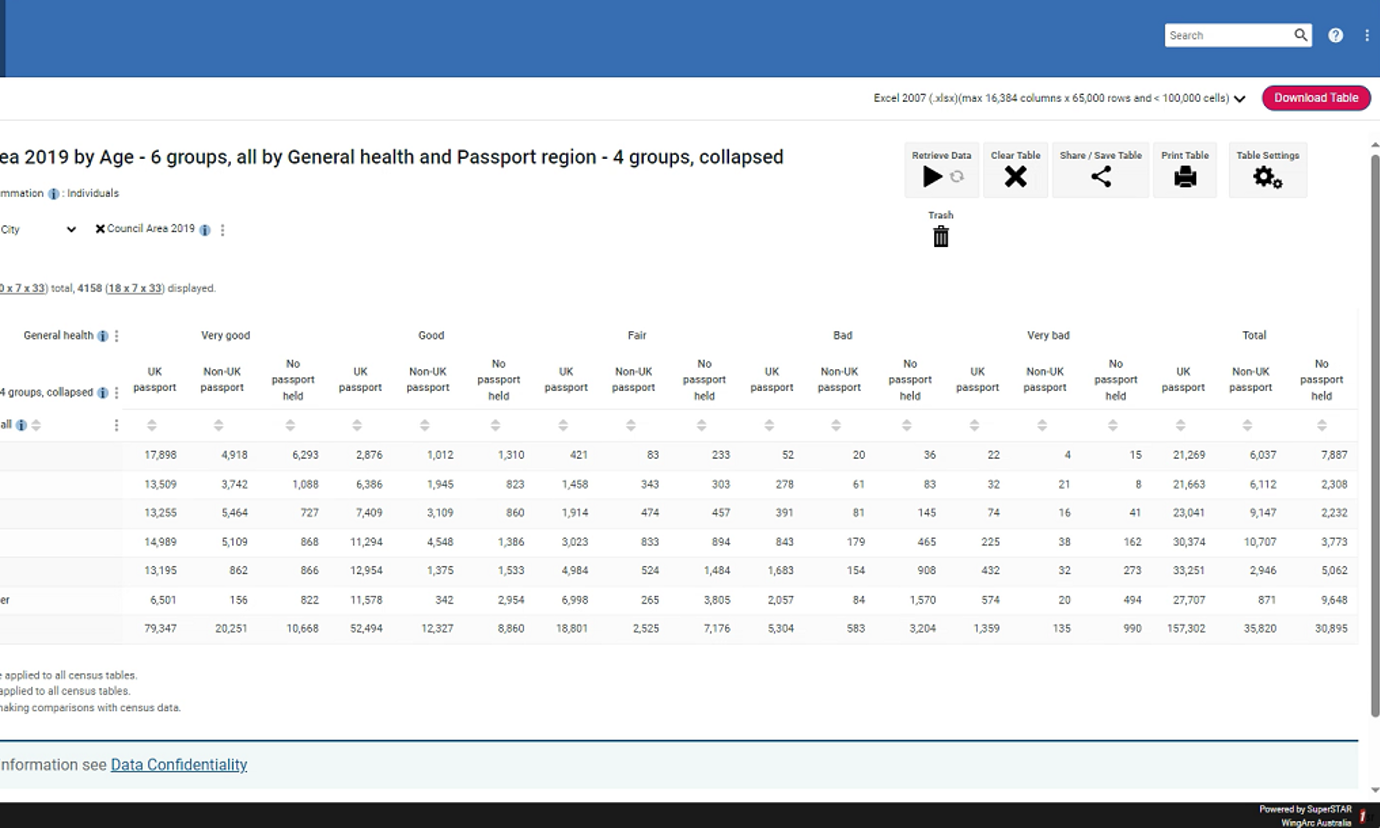
This process can be copied with any different combinations of up to 4 variables, as well as with combinations of 2 or 3 variables.