Administrative Data Based Population, Household and Ethnicity Estimates (2016-2022) - Statistical Research
Disclaimer: These statistical research outputs are not the OFFICIAL STATISTICS for Population, Household or Ethnicity Estimates for Scotland. The Official Statistics can be found at Scotland’s Census website, and in the statistics and data section of National Records of Scotland’s website.
This publication reports on the results of research into how population, household and ethnicity estimates might be produced using a range of administrative data.
Any presentation or use of these research outputs should make clear to users the nature and purpose of the statistics.
Published 27 February 2025
Read about our Quality Assurance of Administrative Datasets
Statement of voluntary compliance
Download the data used in our charts
1 - Executive Summary
Background
This publication presents a revised version of Scotland’s Administrative Data Based Population Estimates (ABPEs) (version 4), covering 2016 to 2022, including an ABPE for census day 2022. It also presents Administrative Data Based Household Estimates (ABHEs) for these times, and research on an Administrative Data Based Ethnicity Dataset (ABED). Three previous iterations of ABPEs have been published on the NRS website.
These administrative estimates have been created by acquiring and linking data from a range of sources. Inclusion rules are then applied to cut the dataset down to individuals expected to be resident in Scotland on the reference date. The resulting dataset is called Scotland’s Integrated Demographic Dataset (SIDD) and the ABPEs are counts of the SIDD. ABHEs are calculated by grouping individuals on the SIDD by address and the ABED links on ethnicity information where available.
NRS is continuing research to develop statistics produced using administrative data. Part of this development includes acquiring data from other providers including the Department for Work and Pensions (DWP) and HM Revenue and Customs (HMRC). Methodology changes are also being considered including the use of estimation techniques or whether the statistics could be improved by considering estimates of the changes in population between years, for example births, deaths and migration, alongside the current approach of re-measuring the population with administrative data each year. The Office for National Statistics has developed a Dynamic Population Model as part of its ambitions to transform population and migration statistics for England and Wales. NRS is exploring whether a similar approach would increase accuracy of administrative estimates in Scotland.
Key Findings
Population
The most accurate population estimates are from the census, the most recent being in 2022. Between censuses, timely estimates are provided by the Mid-Year Population Estimates (MYEs). When census estimates become available, the MYEs are rebased to produce the most accurate estimates for the intercensal period. The ABPEs can be produced in a timely way, so we wish to understand how they perform relative to the (original) MYEs when benchmarked against the rebased MYEs.
Key findings from our analysis are set out below:
· The ABPE for Scotland is 0.22 per cent lower than the Census 2022 estimate
- Differences are larger by age, but for most ages the ABPE is within two percent of the census
- Differences are larger by sex with the ABPE 0.07 per cent lower for females and 0.37 per cent lower for males
- Differences are larger by Local Authority (LA), although for all but one LA the ABPE is within the census 95-per cent LA confidence interval target of 3 per cent
- 95.6 per cent of census records appear on the SIDD
- 89.4 per cent of individuals appear at the same address on the census and the SIDD, and 98.2 per cent appear in the same local authority
· For the years of this study between censuses (2016–2021) the ABPEs are closer to the rebased MYEs than the original MYEs are
· The ABPEs fluctuate more between years than the MYEs do
Households
The ABHEs are compared with the census estimates, and the annual official household estimates. Similar to population estimates, revisions are made to the back series of official household estimates to incorporate information from the most recent census. Those are referenced as rebased household estimates.
· The ABHEs are on average 6.8 per cent lower than the rebased household estimates.
· The ABHE is around 7.1 per cent lower than the Census 2022 estimate.
· The ABHEs have fewer smaller (one or two person) households and more larger (three or more person) households than the official estimates.
Ethnicity
- When using only the linked administrative data we currently have available to us, a stated ethnicity can be found for 58.24 per cent of individuals.
- When administrative data is combined with the Census 2011 data, a stated ethnicity can be found for 76.6 per cent of individuals.
Conclusion
The ABPEs compare favourably with the original MYEs when benchmarked against the census and rebased MYEs. However, the MYEs are at their least accurate in the latter part of the intercensal period, which is when the ABPEs are available. The ABPE breakdowns, both by age and LA, are similar to census estimates, with differences by LA generally within the census target uncertainty.
The ABPEs show greater fluctuation between years than any of the official population estimates. This report discusses several reasons why this may occur, but more work is required to fully understand these trends. The fluctuations may be caused by: changes to underlying data sources (e.g. COVID-19 affecting healthcare interactions), an artefact of the modelling approach which re-counts the population each year, and genuine change in the population not captured by the official estimates.
NRS’s plans to collect new data and develop modelling approaches, including researching a Dynamic Population Model for Scotland. This would provide additional information and model the change in population between years, smoothing out the trend.
The ABHEs are not as close to the official estimates, underestimating the total number of households and overestimating household sizes. Further development includes acquiring Local Authority council tax data, which would provide more information on the number of households, and methodological developments such as estimation techniques or applying additional rules to the SIDD.
Administrative data can provide substantially more population coverage for ethnicity than could be achieved using surveys, but lower than what could be provided by a census.
2 - Introduction
Project Aims
National Records of Scotland (NRS) has an ambition to consider the best combination of administrative data, census and surveys when producing statistics on Scotland’s population. Administrative data is information created when people interact with public services, such as schools, the NHS or electoral register and collated by government.
The system is currently based on the decennial census, with population and household statistics updated annually. NRS is researching whether integrating administrative data into the system would allow statistics to be produced more; frequently, in the case where statistics are currently not updated annually; accurately, as the quality of population and household estimates currently reduces further away from the census; and better targeted to user needs.
The aims of the project are:
- To help inform future recommendations for the census and demographic statistics beyond 2022. This includes investigating administrative data collected by public bodies and services, which could be used to augment, complement or replace data collected by a traditional census.
- To improve the coherence of our demographic statistics across the UK. This project is working in partnership with the Office for National Statistics (ONS) and the Northern Ireland Statistics and Research Agency (NISRA) who are also researching transformation of statistics through greater use of administrative data.
- To support discussion with data suppliers and stakeholders on the application of this work and receive feedback on these estimates to inform future developments.
Although it was not an aim of the project, this work was instrumental in developing the NRS response to the lower-than-expected Census 2022 return rate. The research into administrative data sources, linking methodologies and governance systems (for example, privacy panels) allowed NRS to respond quickly to secure data and approvals to incorporate administrative records into our census design, ensuring high quality outputs.
UK Context
ONS has a programme on the future of population and migration statistics in England and Wales. In 2023 ONS consulted on a proposal to put administrative data at the core of population statistics. The proposed system would include producing a Statistical Population Dataset (SPD) by linking administrative datasets. As the SPD would approximately contain all the usual residents in the population, it could provide an approximate count of the population. ONS assessed the accuracy of the SPD counts against the census-based 2021 estimate, and concluded that this would not meet their quality standard. For the total England and Wales population ONS are looking to be within 0.15 per cent of the Census 2021-based MYE, and their SPD was 1.2 per cent lower. ONS also found that 64.4 per cent of Local Authorities (LAs) were within 3.8 per cent of the census-based estimate. ONS are looking for 97 per cent of all LAs to meet this quality standard. To improve the accuracy of the population estimate, and to provide coherence between changes in population over time and direct estimates of changes from vital events and migration, the SPD counts would be reconciled with the changes using a Dynamic Population Model (DPM). ONS found that accuracy could be improved further by using coverage adjustment methods on the SPD counts before applying these to the DPM.
Northern Ireland Statistics and Research Agency also published a comparison of its SPD with the 2021 Census in December 2024 and found it to be within 0.3 per cent of the official census estimates for Northern Ireland.
The work presented in this report is based on Scotland’s Integrated Demographic Dataset (SIDD) which is the equivalent of the SPD in other UK countries. NRS recognises the importance of coherence of UK estimates and is working closely with ONS and NISRA for this project. As part of this, NRS is researching whether a DPM solution would be appropriate for Scotland, not just to improve estimates, but also to ensure coherence of estimates across the UK.
Current Publication
The administrative data population estimates are now available for June 2016 to 2022, to correspond with Mid-Year Estimates (MYEs), and March 2022 corresponding with Scotland’s Census 2022. This publication supersedes any outputs in the earlier statistical research, which were based on versions 1, 2 or 3 of our methodology. The current estimates are based on version 4 of our methodology, where the linking method has been adjusted, and business rules for exclusion/inclusion have been refined, in the light of research and comparison with the census. This research is therefore an important step forward in our understanding of how current administrative data might be used to provide key demographic statistics.
For the first time we are presenting ABHEs (for the same time period as for the ABPEs, 2016–2022). We also present an Administrative Data Based Ethnicity Dataset (ABED) for March 2022.
The purposes of this particular publication are to:
- Compare the ABPE series with the MYEs
- Compare the census-day ABPE with the Census 2022 estimates
- Compare dataset behind the ABPEs (SIDD) with the census dataset
- Present household estimates produced from the SIDD
- Report on the coverage of ethnicity estimates produced from the SIDD
- Update the methodology to version 4
Why Statistical Research Rather than Official Statistics
For producers of official statistics, such as NRS, the term ‘Statistical Research’ is used to refer to research that is at an early stage of its development and would not meet the requirements for official statistics or official statistics in development. By using this term, NRS is able to formally publish material that can support further discussion and development. This publication presents the fourth iteration of our methodology and is still regarded as statistical research. As with our earlier publications on Administrative Data Based Population Estimates, NRS have provided a voluntary adoption statement to show how the principles of the Code of Practice for Statistics have been followed for this publication.
These estimates should not be considered as a replacement for the Accredited Official Statistics Publication for MYEs or Households and Dwellings in Scotland. If you require population estimates for any purpose, such as resource allocation, planning of services such as education and health, or to incorporate into other statistics, please use the latest mid-year population estimates available on the National Records of Scotland (NRS) website. The figures in this publication should not be used for these purposes.
Security and Confidentiality
Security and confidentiality are of critical importance and we have taken action to ensure that personal information is safe. Only necessary data is collected for this project and when received it is stored securely, with access limited to authorised personnel. Personal information, such as names and addresses, are de-identified and datasets are brought together for linking and analysis after this has occurred.
The project has been scrutinised and approved by privacy panels and the National Statistician’s Data Ethics Committee. NRS is committed to transparency with users and the public in all aspects of this project. More information on how datasets are de-identified, the governance arrangements and datasets can be found in sections 3 and 4 of ABPE Scotland 2016: Methodology Report (v1).
3 - Acknowledgements
The process of producing this research on population estimates from administrative sources has involved a number of organisations and individuals. NRS would like to thank our data suppliers. The suppliers, along with the datasets they provided, are given in Table 1.
Table 1: Suppliers of the data used in the analysis, and the datasets supplied.
|
Supplier |
Dataset |
Description |
|
Electoral Register (ER) |
People registered to vote in Scotland |
|
|
HESA |
Higher education students studying or domiciled in Scotland |
|
|
NHS Central Register (NHSCR) |
People who are or have been registered with a GP in Scotland, or whose birth was registered in Scotland |
|
|
Vital Events |
Birth, death, marriage and civil partnership registrations |
|
|
Public Health Scotland (PHS) |
Health Activity (HA) |
Patients who have interacted with the NHS in the previous three years |
|
Scottish Funding Council (SFC) |
Further Education Statistics (FES) |
Further education students studying in Scotland |
|
Scottish Pupil Census (SPC) |
People enrolled in state funded schools in Scotland |
NRS would also like to thank colleagues at the Scottish Government and eDRIS (part of Public Health Scotland (PHS)) for their ongoing support with this project. We would also like to thank all the stakeholders and peer groups, who have contributed their expertise and knowledge to support this work.
4 - Comparison Estimates
The administrative data based estimates presented here are compared against the census dataset and estimates, the mid-year population estimates and the NRS household estimates.
Scotland’s Census 2022
Every 10 years a census is carried out of Scotland’s population. The latest census was planned for March 2021, but was delayed to March 2022 because of the COVID-19 pandemic. The census covers all usual residents of Scotland. A usual resident is defined as: anyone who on Census Day, 20 March 2022 was in the UK and had stayed or intended to stay in the UK for a period of 12 months or more, or had a permanent UK address and was outside the UK and intended to be outside the UK for less than 12 months.
The 2022 Census achieved a household return rate of 89 per cent. From the collected data, an individual-level dataset was produced, along with estimates of the total population and number of households. The estimates have been created using statistical methodologies to represent the whole population of Scotland, including non-respondents.
Mid-Year Population Estimate Methodology
In Section 5, the results are compared with the respective MYEs.
The originally published MYEs are the official population estimates with a reference date of 30th June each year and are typically available the following spring. These are based on the 2011 Census estimates, updated annually to account for migration births and deaths. As migration is difficult to measure accurately, the MYEs become less accurate the longer it has been since the previous census. These estimates are referred to as the original MYEs, or 2011-based MYEs in this report.
Once the subsequent census estimates are released, it is possible to identify how much the original MYEs have drifted from the true population over the intercensal period. Using this information, it is possible to look again at the estimates during the intercensal period and adjust the original estimates using all available information. These adjusted estimates are referred to as rebased MYEs, and are believed to be the most accurate available estimates for intercensal periods. These estimates are referred to as rebased MYEs (R-MYEs) or 2022-based MYEs in this report. The R-MYE trends shown in this report include the census estimate for March 2022, and the 2022 mid-year estimate calculated using the 2022 census estimates. The 2011-based MYE trends shown in the report include estimates for March and June 2022 based on the 2011 census estimates.
As the rebased MYEs are the most accurate estimates, these are the estimates the ABPEs are benchmarked against for 2016 to 2021. As the ABPEs and the original MYEs can be produced in similar timescales, we wish to compare how close each of these methods get to the rebased MYEs.
NRS Household Estimate Methodology
In Section 8, the results are compared with respective number of households and household composition in Scotland. Those official statistics are published in annual reports on Households and Dwellings in Scotland. The household estimates for intercensal periods are rebased when a new census is published. The rationale for these updates is as set out above for rebased MYEs. A full description of the methodology used for the household estimates is published on the NRS website, but a summary is provided here.
A household is a group of people living together in a dwelling. Scottish Assessors record all dwellings in Scotland and from that base, council tax records can identify whether a dwelling is occupied, vacant or a second home. NRS receives an annual snapshot of these records in September. The number of occupied dwellings is found by subtracting the number of vacant or second homes from the total number recorded by the council; that provides an initial estimate for the number of households. The estimated number of households is adjusted back to June, based on the September estimates from the current and previous year.
The estimated number of households is further adjusted to account for (i) the estimated number of occupied dwellings that contain more than one household, and (ii) the estimated number of communal establishments included in council tax records. These estimates are based on census data from the current and previous census collections.
The Scottish Household Survey (SHS) is used to estimate the number of different types of households, which refers to how many adults and children are in the household, in Scotland as a whole. Due to the COVID-19 pandemic, the approach for the SHS in 2020 and 2021 was changed to use remote interviewing instead of the usual survey fieldwork. The results of the SHS 2020 and 2021 are not deemed to be directly comparable to SHS results for previous years. It is therefore not possible to determine whether observed differences in results for 2020 and 2021 and those for previous years represent genuine changes or are due to changes in how the survey was administered. Data on household composition for 2020 and 2021 have therefore not been presented in the NRS publication, leaving us with no comparator data on household composition for Administrative Data Based Household Estimates (ABHE) in those years.
5 - Comparison of Administrative Data Based Population Estimates and Rebased Mid-Year Estimates
Overall Trend
Figure 1 shows the version 4 ABPEs from 2016 to 2022. In all years the ABPEs are similar to the R-MYEs always being within 1 per cent of the official estimates. In the years covered by this research, 2016–2022, the ABPEs are closer to the rebased estimates than the original MYEs are. However, Figure 1 also shows that the ABPEs have a different trend to both the MYEs and R-MYEs, with greater fluctuations between years.
Figure 1: Population change according to MYEs, R-MYEs, and ABPEs, indexed against the June 2011 MYE.
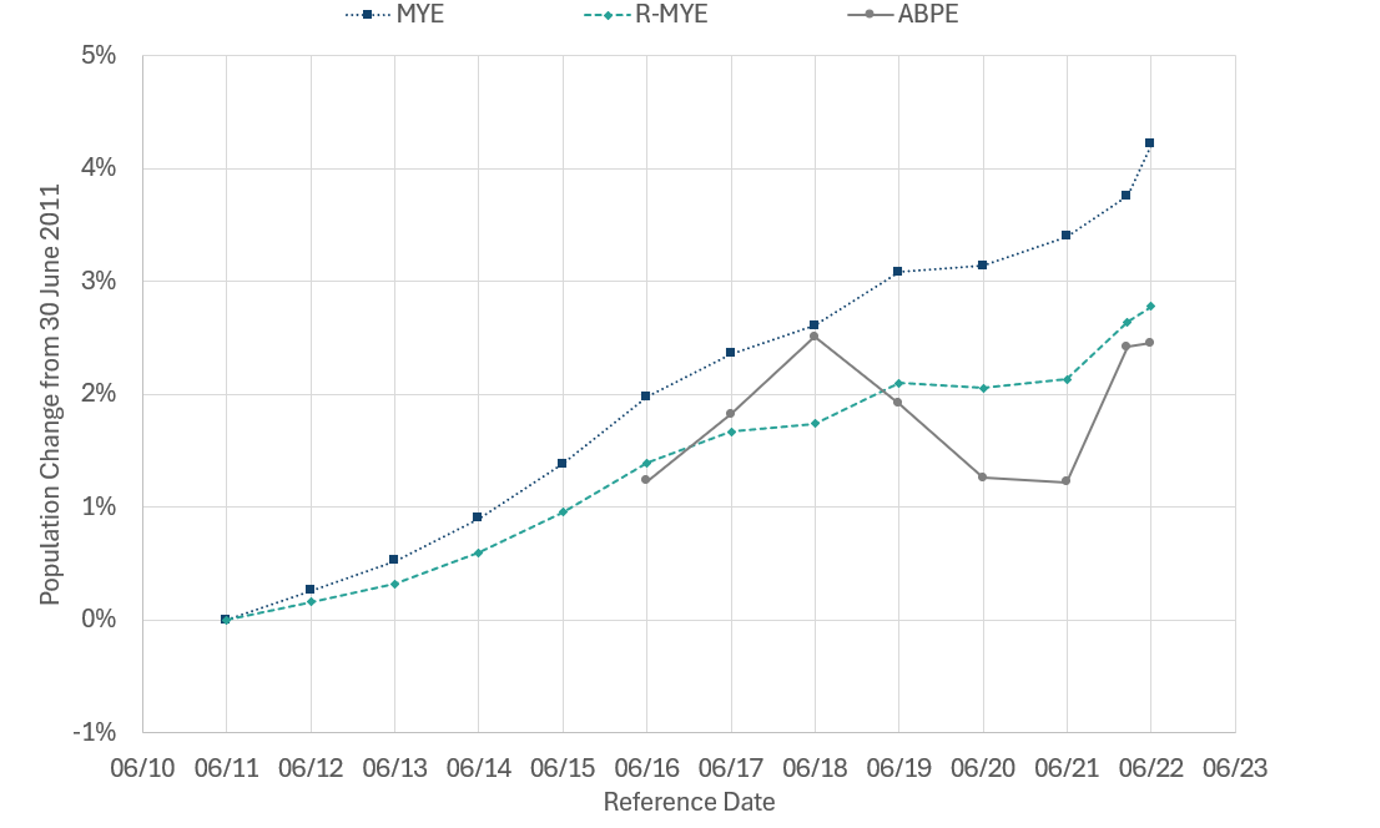
The ABPEs show a larger increase in 2017 and 2018, followed by a decrease in 2019 and 2020, increasing again in 2022. In general, the MYEs show a more gradual increase across all years. Work is ongoing to understand the differences in population trend, but some initial points can be made.
ABPE datasets do not just change with changes in the population, but also with events that affect the original data source. For example, in 2020 and 2021 NHS services were affected by the COVID-19 pandemic, with individuals interacting less often for routine services. The dataset in our analysis does not include vaccination information as an indication of presence in the population. This could account for the ABPEs for 2020 and 2021 being notably lower than the rebased MYEs. It is not yet clear whether this is indeed the effect that is causing the fluctuations, but it is an example of an effect of using administrative sources for population estimation. Securing more data could help address such issues. NRS are currently pursuing administrative data from DWP and HMRC. A broader base of data sources would help avoid fluctuations that affect a particular sector. Furthermore, using estimation techniques could help address under coverage, which may be particularly acute in some years.
A second consideration is a comparison of the modelling approach. The MYE method measures the change in population between years whereas the ABPE re-measures the population from scratch each year. As the total population is much larger than the annual changes in population, even small modelling error would lead to much greater changes in the ABPEs than the MYEs, making the ABPEs more prone to fluctuate over time. NRS are researching whether introducing a Dynamic Population Model (DPM) should be introduced for Scotland, pursuing a similar methodology to that developed by ONS. This takes account of changes in the population from migration and vital events and also estimates from earlier years. This could help stabilize the trends and reduce random fluctuation over time.
The final point is that the ABPEs may be capturing a greater amount of genuine migration within the population. This is discussed in more detail below as we break down the trend by age.
Trend by Age
To further understand why the ABPE trend differs from that of the MYE, we can look at the trends broken down by age (see Figure 2). This shows that the ABPEs and rebased MYEs follow similar trends for the 0–17 and 46+ age bands, indicating that differences are driven by administrative records for younger adults. For 18–25 year olds, the ABPE in 2016 is similar to the 2011 estimate before decreasing over time, while the rebased MYEs decline gradually over the whole decade. The ABPEs for the 26–35 age group, and, to a lesser extent, the 36–45 age group show an increase in 2018 relative to the MYEs, followed by two years of relative decline.
The change from 2018 to 2019 is of particular interest. One possibility is that the 2018 ABPE is an outlier, and so the 2016 to 2019 trend should be smoother. The difference between the ABPEs and MYEs in 2020 and 2021 could be due to how the administrative data sources were affected by COVID-19, with young people less likely to interact with health services (excluding vaccinations, which we did not have for this project) during this time. In this hypothesis the MYEs have captured the more accurate trend.
Figure 2: Estimated population change from 30 June 2011 for ABPEs and R-MYE by age bands.
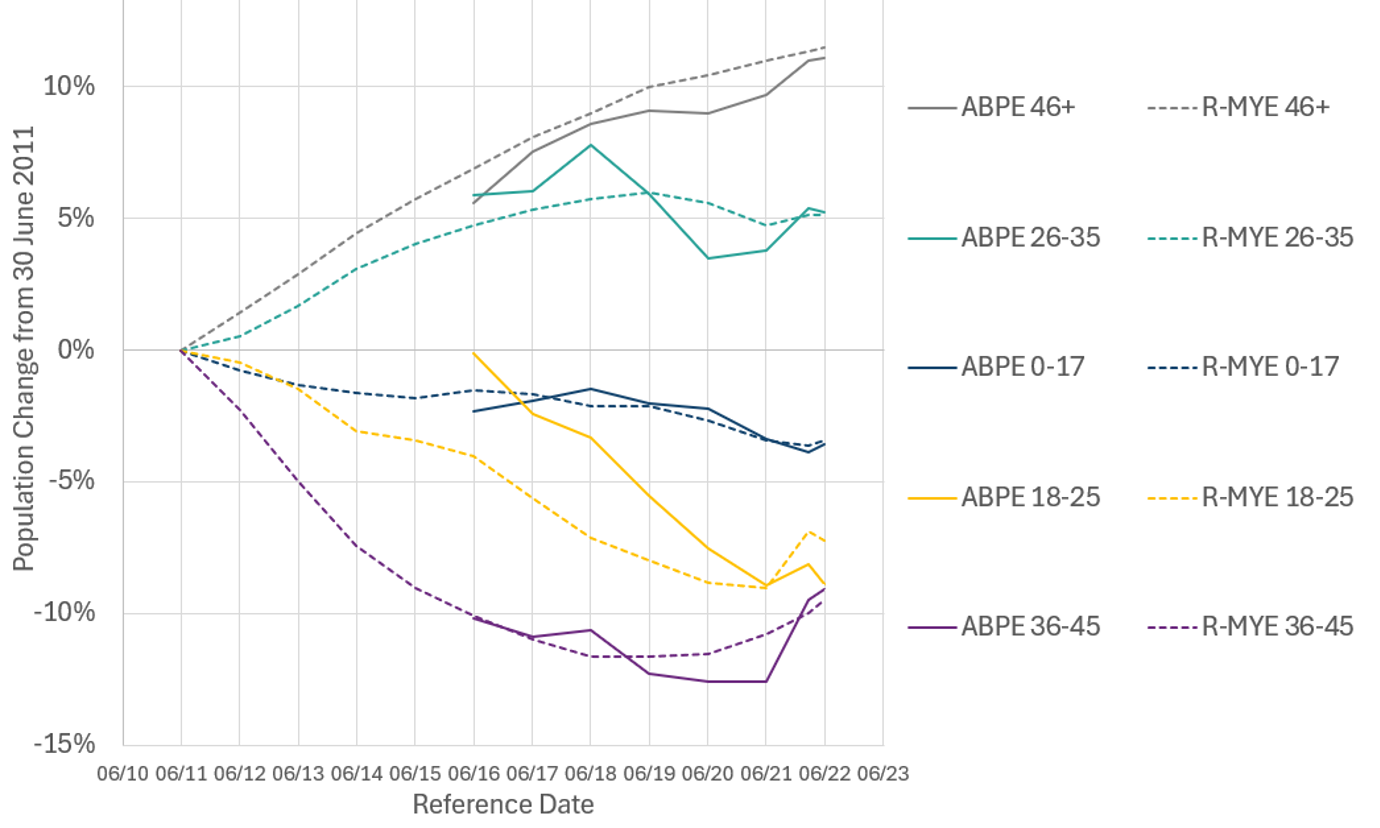
Another possibility is that events such as Brexit or COVID-19 resulted in changing migration patterns, leading to a drop in the population, which was captured by the ABPEs. Further research is needed to explore this trend and the reasons behind it.
6 - Comparison of Administrative Data Based Population Estimates and Census Estimates
The Scotland-level census day ABPE is 0.22 per cent lower than the 2022 Census estimate (5,428,036 for the ABPE, compared with 5,439,842 for the census). This difference is smaller than the census 95 per cent confidence interval of 0.51 per cent. The difference is similar to ONS’s quality standard of 0.15 per cent for the discrepancy between their ABPE and official estimate.
Comparison by Age
Figure 3 shows that the ABPE and census estimates are similar when broken down by age.
Figure 4 explores this in more detail, showing the residuals by age and sex. For most ages, the ABPE for both males and females are within two per cent of the census estimates. From about 40 to 65, the estimates for males tend to be higher than the census. Above age 65 the estimates for both males and females are generally lower than the census. NRS are currently seeking pensions data from the Department for Work and Pensions to assist with estimating the older age groups.
The largest differences are seen for ages 18 to late 20s. From age 20 the ABPEs are higher than the census for females, and lower for males. For 18 and 19 year olds both males and females are lower than the census. These ages are more difficult to accurately capture in administrative datasets. Younger people may move more frequently, for example students, which causes administrative data to go out of date more quickly. They are also less likely to interact with health services as frequently. We are continuing to explore the underlying datasets to understand these differences, and are working to acquire further administrative datasets, for example HMRC data, which could provide information on working people in their 20s, and provide additional evidence for this group.
Ages 0, 1 and 2 show larger differences from the census than for most other ages for children. However, these differences are smaller than the adjustments made to the census for these ages. Section 3.6.3 Babies Adjustment of the Census Quality Assurance Report indicated that 6.6, 4.4 and 2.1 per cent for ages 0, 1 and 2 respectively.
Overall, the ABPE is 0.07 per cent lower than the census for females and 0.37 per cent lower than the census for males.
Comparison by LA
Figure 5: Difference between ABPE and Census 2022 by LA. Purple bars show the difference, the hollow black bars show the census 95 per cent confidence range.
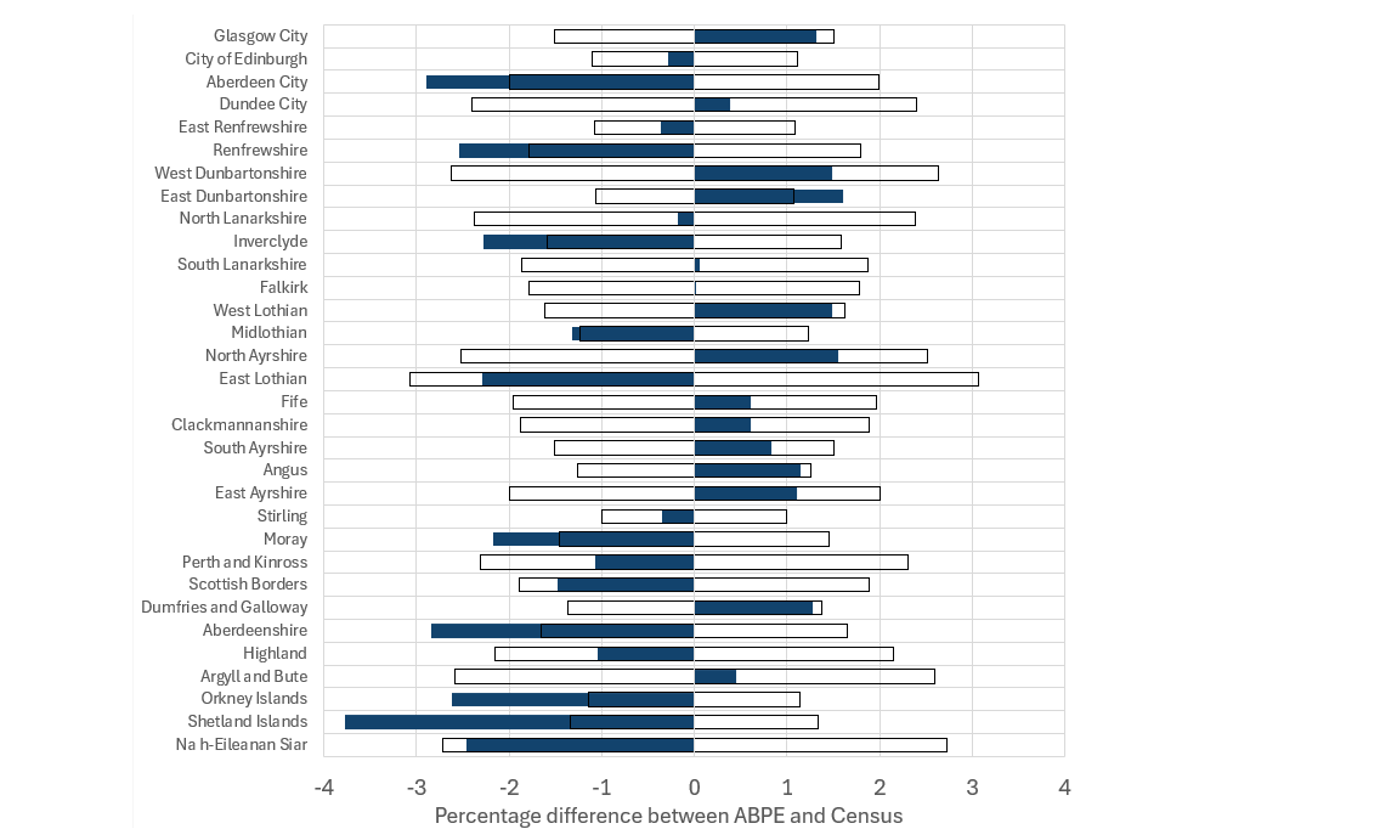
Figure 5 shows the difference between the ABPE and 2022 Census by LA. These are sorted from the most urban at the top to the most remote rural at the bottom. The figure shows that the differences between the ABPE and the census tend to be larger at LA level than nationally (where the difference is 0.22 per cent).
However, in all but one of the LAs the difference is within the census target for the 95-per cent confidence interval (3 per cent) for the LA-level estimates. The ABPE for Shetland Islands is 3.77 per cent below the census.
For 23 of the 32 LAs the difference between the ABPE and census is within the census 95-per cent confidence interval. If the ABPEs were biased, so that they consistently over or underestimated the population, or performed differently in urban and rural areas, then we would expect the ABPE to differ from the census in many LAs. Also, if the ABPEs had random errors much larger than the census random errors, then we would again expect large differences between the ABPE and census for many LAs. It is difficult to estimate the bias and random error in the ABPEs directly, but the comparisons with the census across areas can give a rough indication.
If the ABPEs were unbiased, and the ABPE random error was the same as that for the census, then we would expect about 27 of the 32 LAs to have the difference between the estimates to be smaller than the uncertainty. As there are 23 LAs meeting this criterion, this suggests either that there is bias in some of the estimates, or that the ABPE random error is larger than that for the census. However, as 23 is not that different from 27, this suggests that the bias is not that large and that the ABPE random error is not much larger than that for the census.
Despite this success, there are patterns in these differences that suggest further improvements might be made, or at least the differences could be better understood. For example, remote rural LAs tend to have the ABPE lower than the census, while intermediate areas like Ayrshire and Dunbartonshire tend to have the ABPE higher than the census.
0–17 Year Olds
Some of the LAs where the ABPE is lower than the 2022 Census for 0–17 year olds (Aberdeen City, Aberdeenshire, East Lothian, City of Edinburgh, see Figure 6) were where the original census estimates were already above the school census counts for school age children, and so these were not increased during census QA (as reported by the Census Quality Assurance Report). As the school census is one of the main ways for the ABPEs to detect school-age children, the discrepancy between the census and school census means that it is perhaps unsurprising that the ABPE is lower here.
In other LAs, such as Glasgow City, Fife, Angus and Clackmannanshire the original census estimates were lower than the school census, and so were increased to match the school census. However, these LAs also have independent schools, that are not included on the school census, and so it seems plausible that these LAs contain more school-age children than are listed on the school census. The ABPE could be detecting independent-school children from the health activity data. Therefore, in these cases the ABPE may be closer to the correct population.
18–22 Year Olds
For 18–22 year olds (see Figure 7) one effect is that most LAs with universities (Glasgow, Edinburgh, Aberdeen, Dundee, Renfrewshire, Stirling, East Lothian and Highland) have the ABPE lower than the census. Conversely, LAs with low levels of deprivation where we might expect many young people who attend these universities to have grown up (East Dunbartonshire, East Renfrewshire, South Ayrshire) have the ABPE higher than the census. (Fife is included in this group, suggesting that it is a net exporter of students, given the small size of University of St Andrews relative to the size of the LA.)
While people are students their ABPE location will be determined by the HESA term-time location. However, when their studies finish the location will revert to other sources, for example health data, which may still have a parental address. In general, there may be net migration in this age group from LAs in suburban areas, or accessible towns, to the large urban areas of employment. Any lag in the administrative data in these movements being recorded will therefore lead to the ABPEs underestimating urban areas and overestimating suburban and accessible LAs.
Two more LAs that have substantial differences for this age group are Moray, and Argyll and Bute. These are two LAs with notable military bases (RAF Lossiemouth in Moray and HMNB Clyde (Faslane) in Argyll and Bute). It is not always clear the extent to which individuals at these bases would be considered usual residents, which can lead to differences in the estimates between census and the ABPE.
23–27 Year Olds
For 23-27 year olds (Figure 8) the patterns are roughly similar. It is notable however that smaller cities with universities like Dundee and Stirling have the ABPE higher than the census. This may be because a higher proportion of students leave the LA when they graduate, compared with Glasgow, Edinburgh and Aberdeen, which perhaps have enough employment opportunities to retain, or even attract, graduates. If these movements failed to be detected by the administrative data then people might linger in Stirling and Dundee on the administrative data, while in reality they have moved to larger cities, leading to the ABPE overestimating Stirling and Dundee, but underestimating the larger cities. Again, this suggests that more needs to be done to detect movements of individuals, particularly around the student ages.
Furthermore, two of the LAs that showed over-coverage in the 18–22 age group, East Dunbartonshire and East Renfrewshire, are notably higher than the census for the 23–27 year old group. This effect will be explored further in Section 7.
As for the 18–22 age group, Moray, and Argyll and Bute show notable differences, likely due to the military bases there.
Ages 28+
For ages 28+ (see Figure 9) the pattern is less obvious, and there are not as large differences seen here as in the other age groups. One feature that can be seen is that the LAs that had the largest increases in the rebasing (Inverclyde, Renfrewshire and East Lothian, excluding Argyll and Bute, which has already been discussed) now show the ABPE notably below the census for this age group. It may be the case that the data that led to the MYEs underestimating the population of these LAs also leads the ABPEs to underestimate them.
Summary of Comparison between ABPE and Census Estimates
The ABPE and census Scotland-level estimates are very similar, within 0.22 per cent. Differences are larger by sex. Differences are also larger by age, but for most ages the ABPE is within two per cent of the census. Differences are larger by LA, although for all but one LA the ABPE is closer than 3 per cent to the census estimate.
7 - Comparison of Scotland’s Integrated Demographic Dataset and the Census Dataset
The March 2022 Administrative Data Record Set (ADRS) was linked to the dataset of 2022 Census responses at individual level. The ADRS includes individuals on administrative dataset who have been filtered out of the SIDD because they are not believed to be usual residents on the reference date.
Overall Comparison of SIDD and Census
The number of people by whether they appear on these datasets is shown in Table 2. These show generally encouraging results. Not only is the ABPE similar to the census estimate at aggregate level, the SIDD, to a first approximation, covers the same individuals as the census. 4.4 per cent of the census responses do not appear on the SIDD, and only 1.3 per cent of census responses do not appear on the ADRS. This could mean that these individuals genuinely are not on the administrative data, or it could be that the individuals are on the ADRS, but that the records failed to link.
Table 2: Number of individuals by whether they appear on the ADRS, SIDD or census responses.
|
|
On Census |
Not on Census |
Total |
|
Not on ADRS |
60,330 |
N/A |
60,330 |
|
On ADRS but not on SIDD |
150,721 |
5,943,230 |
6,093,951 |
|
On SIDD |
4,597,503 |
830,533 |
5,428,036 |
|
Total |
4,808,554 |
6,773,763 |
11,582,317 |
Around 6 million individuals appear on the ADRS but not the census. This is to be expected as the full NHSCR dataset includes individuals who are known to have died or are believed to have left Scotland. Furthermore, there may be cases where an individual appears on multiple administrative datasets, but not all of these records linked to each other and were resolved. For example, if someone appears on NHSCR, health activity and electoral register, but appear on electoral register at a different location, then the electoral register record might not have linked and would end up as a distinct individual on the ADRS. The business rules are set up so that such cases are filtered out, so that we would just end up with the record that appears on the NHSCR and health activity.
The number of individuals on the SIDD but not the census is 830,533. Many of these individuals will be among the estimated roughly 555,000 usual residents who did not respond to the census. The remaining will be a combination of individuals who are not actually usual residents on census day (over-coverage) or where the record failed to link.
Comparison of SIDD and Census by Age and Sex
Figure 10 explores these residuals further by showing them by age and sex. These are shown relative to the total number of people on the SIDD with that combination of age and sex. Encouragingly the pattern of people on the SIDD but not census corresponds to the expected pattern of census non-response, with more males than females, and a higher proportion of young adults than other age groups. The proportion of people on the census but not the ADRS varies little with age and sex, suggesting there is no particular pattern of people not on administrative data at all (or of linking error).
However, the proportion of people on the census but not the SIDD does show a pattern. Here the proportion is highest among young adults, particularly for males. As the total estimates for this group remains roughly in line with the census estimates, this suggests that the absolute over- and under-coverage in the SIDD is higher for this group than for other demographic groups. This suggests that for this group there are more people who pass the business rules but are actually no longer usual residents (over-coverage), and also there are more people who are usual residents but do not pass the business rules (under-coverage).
Comparison of Locations on SIDD and Census
Overall Comparison
For the individuals who appear on both the census and the SIDD, we can explore the level of similarity between the location recorded for them on each source (see Table 3). Everyone on the SIDD will have a postcode recorded, as that is part of the business rules, but not everyone will have a Unique Property Reference Number (UPRN) recorded. Encouragingly, most people (89.4 per cent) appear at the same address on the census and the SIDD, and 98.2 per cent appear in the same LA.
Table 3: Level of location similarity between census and SIDD for individuals who appear on both.
|
Level of similarity of location |
Percentage of individuals who appear on census and SIDD |
|
UPRN same |
89.4 |
|
UPRN missing but postcode same |
2.3 |
|
UPRN different but postcode same |
1.9 |
|
Postcode different but data zone same |
0.5 |
|
Data zone different but local authority same |
4.1 |
|
Local authority different |
1.8 |
|
Total |
100.0 |
Comparison by Age
Figure 11 shows the proportion of the people on both SIDD and census by level of similarity in recorded location and age. The proportion of individuals who appear in different LAs is highest for young adults. We might have expected this would be highest for student age groups, when many individuals will migrate across Scotland, but this actually peaks at age 25. This may be because while individuals are at university their term-time address is correctly recorded on the HESA dataset, which is prioritized for their location used on the SIDD. However, once their studies finish, they will no longer be on the HESA dataset, so their location will revert to what is recorded on other datasets. If they had not updated their address on NHSCR when they went to university then this would revert to their parent’s address, which would be incorrect for those who stay on near their university, or move elsewhere. For school-age children (5–17) 0.9 per cent have different LAs on census and SIDD. Beyond age 25 the proportion reduces and falls below that for school-age children at age 60. It may be that the LA is most accurate for older people as they migrate between LAs less often.
The proportions of individuals at different data zones and in different postcodes is larger than for those in different LAs but follows a similar pattern.
The proportions with the UPRN different or missing follow slightly different patterns. Here a substantial number of children and those of student ages have different or missing UPRNs. The HESA, FES and school pupil census datasets include postcode but not UPRN. This means that the UPRN needs to be taken from one of the other datasets that the person appears on. That may not be as accurate, or may also be missing, and so could end up being missing or different from that recorded on the census. Children up to age 10 who were born in Scotland will appear on the birth registration data included in the SIDD and so a UPRN can be found there, so the proportion with the same UPRN between the census and SIDD is higher for children 0–10 than for 11–15. As age increases from zero to 10, the proportion where the UPRN differs from the census increases. This is likely because an increasing proportion of these children will have moved since birth. The proportion with missing UPRN drops again at age 16 when individuals start appearing on electoral register, which does include UPRN.
Comparison by Particular LA
The hypotheses discussed above (around individuals appearing in different LAs) can be further investigated by looking at particular local authorities.
Table 4: Individuals with different LAs on SIDD and census, by selected census LA and age.
|
Census LA |
Age |
Total |
|
||||||
|
0-17 |
18-22 |
23-27 |
28-34 |
35-44 |
45-54 |
55+ |
|||
|
East Dunbartonshire |
314 |
73 |
196 |
403 |
450 |
237 |
274 |
1947 |
|
|
East Renfrewshire |
377 |
63 |
227 |
433 |
494 |
227 |
267 |
2088 |
|
|
Glasgow City |
815 |
1572 |
3399 |
3309 |
1618 |
917 |
1002 |
12632 |
|
|
Na h-Eileanan Siar |
25 |
23 |
54 |
39 |
31 |
38 |
80 |
290 |
|
|
Orkney Islands |
10 |
14 |
16 |
19 |
11 |
14 |
35 |
119 |
|
|
Shetland Islands |
10 |
7 |
21 |
23 |
20 |
14 |
18 |
113 |
|
Table 5: Individuals with different LAs on SIDD and census, by selected SIDD LA and age.
|
Census LA |
Age |
Total |
|
||||||
|
0-17 |
18-22 |
23-27 |
28-34 |
35-44 |
45-54 |
55+ |
|
||
|
East Dunbartonshire |
285 |
212 |
708 |
900 |
572 |
367 |
486 |
3530 |
|
|
East Renfrewshire |
223 |
181 |
616 |
804 |
412 |
276 |
395 |
2907 |
|
|
Glasgow City |
1687 |
750 |
2010 |
3070 |
2693 |
1563 |
1774 |
13547 |
|
|
Na h-Eileanan Siar |
22 |
60 |
40 |
33 |
24 |
18 |
34 |
231 |
|
|
Orkney Islands |
9 |
28 |
25 |
25 |
17 |
14 |
28 |
146 |
|
|
Shetland Islands |
15 |
29 |
24 |
20 |
23 |
22 |
16 |
149 |
|
Table 4 and Table 5 show the number of individuals who appear in different local authorities on census and SIDD by age band and which LA they appear on the census and SIDD respectively. East Dunbartonshire, East Renfrewshire and Glasgow City for age bands 18–22 and 23–27 illustrate the point made above. For 18–22 there are around 200 people in each of East Dunbartonshire and East Renfrewshire on the SIDD who are in a different LA on the census. However, there are more than three times this number of 23–27 year olds in the same situation. In these LAs there are more people in this age bands appearing there on the SIDD and elsewhere on the census than the other way round. By contrast, for Glasgow City there are more people appearing there on the census and elsewhere on the SIDD than the other way round.
This pattern is consistent with the hypothesis that individuals’ location can be accurately recorded while they are studying, but afterwards the location information needs to rely on other sources, which may be more out of date. East Dunbartonshire and East Renfrewshire do not have any universities, but there could be many individuals who went to school there who then go to university in, say, Glasgow City. After their studies they might appear in East Dunbartonshire or East Renfrewshire if they are still registered with a GP at their parents’ address, even if they live elsewhere. Further research would be needed to avoid such biases in the locations of individuals on administrative data estimates.
These tables also confirm that the differences in the aggregate estimates at LA level cannot be wholly accounted for by incorrectly locating individuals. For example, Figure 5 showed that the three island LAs had ABPEs between two and three per cent lower than the census. This is equivalent to several hundred individuals in each of these LAs. However, Table 4 shows that in each of Orkney Islands and Shetland Islands, just over 100 individuals appeared there on the census and elsewhere on the SIDD, and 290 for Na h-Eileanan Siar. When also considering individuals who appear on the SIDD in these LAs but elsewhere on the census, the net effect of incorrect placement on the aggregate estimates for these LAs must be fewer than 100 individuals in each case, far too few to account for the aggregate discrepancy seen between the census and ABPE. Therefore, there must be more usual residents in the island LAs who are missed by the SIDD, than people who are not usual residents and are placed by the SIDD in these LAs.
Summary of Comparison of SIDD and Census
Overall, the SIDD and the census mainly contain the same individuals and at the same location. However, there appear to be some biases that lead to discrepancies between the LA distributions seen in the census and SIDD.
8 - Administrative Data Based Household Estimates
The starting point for Administrative data Based Household Estimates (ABHEs) is the SIDD for each year. Households are created by grouping all persons within the same property, indicated by a unique property reference number (UPRN). Therefore, these estimates are based on occupied dwellings from the administrative data, rather than the traditional household definition used in censuses and surveys that is based on “shared facilities”’ The Census defines households as “one person living alone, or a group of people (not necessarily related) living at the same address who share cooking facilities and share a living room or sitting room or dining area”. This approach is the best that can be achieved with our administrative data, as these data sources do not have information on how individuals use their living space. In the 2011 Census there were only 467 dwellings with multiple households, so this approach is unlikely to significantly affect overall household estimates. It is also in line with what ONS do.
To date, communal establishments have not been identified and separated from other occupied dwellings. For the purposes of classifying households in this work, any household with 15 or more individuals is nominally considered a communal establishment and therefore not included in the household composition analysis but is included in the estimate of the total number of households.
Comparator data for ABHEs (June 2016–2022) is provided by the Households and Dwellings in Scotland 2023 publication, hereafter referenced as rebased NRS estimates (R-NRS), and for ABHE (March 2022) the benchmark comes from 2022 Census publication.
Number of Households
Overall Trend
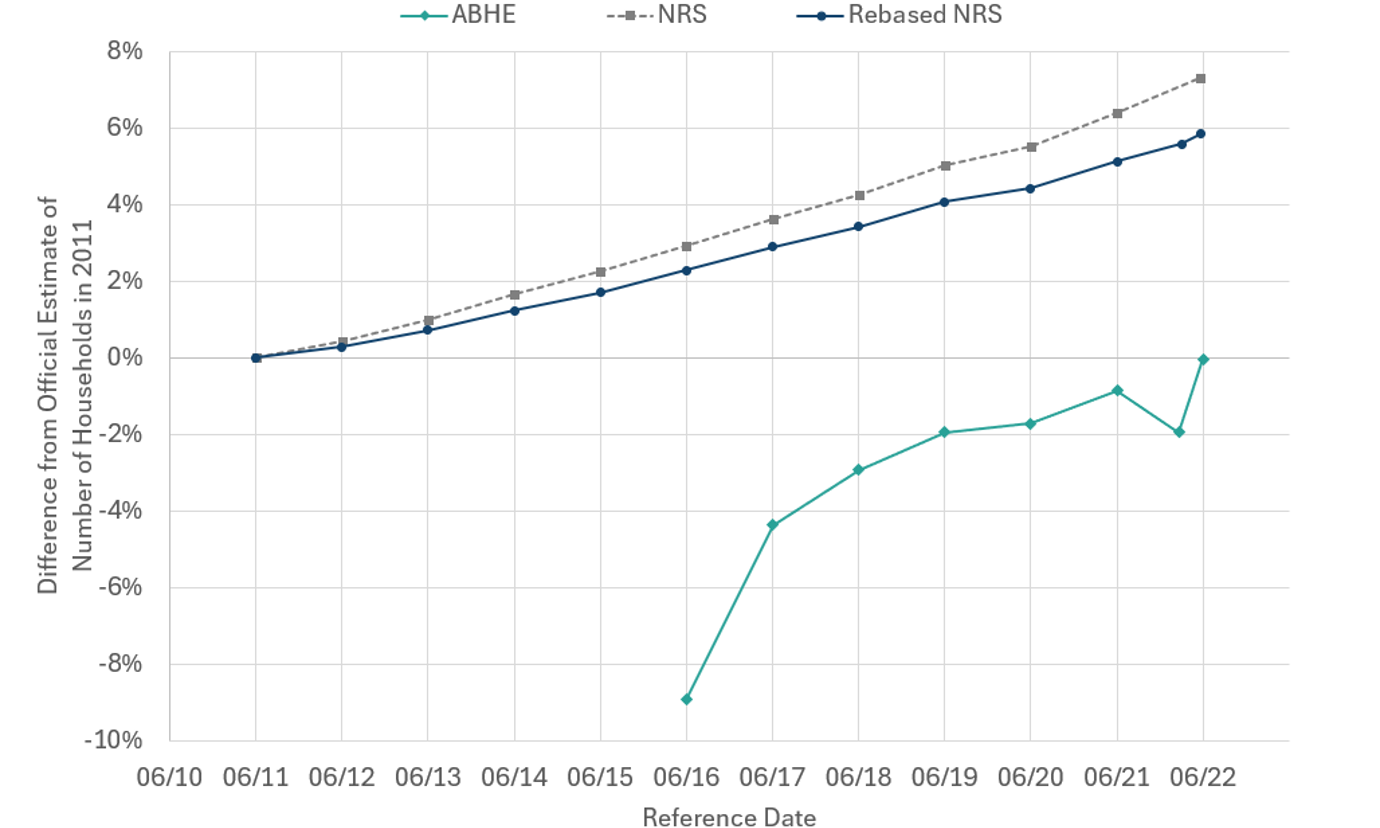
The original household estimates are closer to the rebased household estimates, than the ABHEs are (see Figure 12). The ABHEs are on average 6.8 per cent lower than the rebased official estimates. In the early years of the ABHE series (2016–2019) the administrative data estimates move closer to the official estimates. However, in the later years (2019–2022 excluding March 2022) the difference between the ABHEs and NRS estimates remains broadly constant, averaging around 5.7 per cent. Given the same methodology is applied across all years, this reflects an improvement in data used, with UPRNs improving in quality and completeness across those years. The latest ABHE (June 2022) has the smallest difference at 5.5 per cent. In March 2022 the difference is larger, with the ABHE 7.1 per cent lower than the census. This is partially explained by 4.2 per cent of all individuals on the SIDD having missing UPRN in March compared with 3.0 per cent in June 2022.
Figure 12: ABHE, NRS Household Estimates (2011–2022) and 2022 Census, normalized to the 2011 NRS Household Estimate.
March 2022 Comparison by Local Authority
Focusing on the census day comparison, Figure 13 presents an analysis of households in each LA, ordered with the most urban at the top and most rural at the bottom as in Section 0 (Comparison by LA). Given there are fewer households in ABHE at a national level, this figure presents the distribution of households in each LA as a proportion of the total number of households in ABHE and 2022 Census respectively. As a first estimate of households in LAs, the geographic distribution in ABHE and census is broadly similar. The largest differences are observed in the most urban geographies, where City of Edinburgh is the highest with the proportion of ABHE households 0.4 percent lower than 2022 Census.
Figure 14 presents the household estimates as a percentage difference between ABHE and census, ordered as above from most urban to most rural LA.
The household estimates are lower in all LAs. Some of the largest differences are in cities, where there are many students. As discussed in Section 0, the HESA dataset does not include UPRN, therefore many students cannot be assigned to a household.
The high number of tenement properties in cities may also have contributed to those differences if the UPRN was not included in the source data. Address information for flats was sometimes incomplete, or in a different format, leading to missing UPRN when NRS teams attempted to link it on using an established address database. Rural communities (towards the bottom of Figure 14) also have large differences from census household estimates. Address linking for rural locations without a UPRN similarly proved problematic and would have reduced the number of households identified. Examples here would include farm buildings, where several dwellings have very similar address data, or isolated dwellings with just a property name and no street or locality in the address data.
Household Composition
Two classifications are used for households. The first is that used by the NRS household estimates, shown in Table 6.
Table 6: NRS household estimate categories. A dependent is any child or young adult aged 15 or under or aged 16–18 in full-time education.
|
Household size |
Household composition |
|
One person households |
1 adult female 1 adult male |
|
Two person households |
2 adults 1 adult, 1 dependent |
|
3+ person households |
1 adult, 2+ dependents 2+ adult 1+ dependents 3+ person all adult |
The second classification is close to the household composition (alternative child and adult definitions) used in census publications. The census uses two household composition breakdowns. The main composition uses family, marriage and civil partnership relationships, while the alternative composition simply uses counts of individuals by age. The administrative data approach cannot currently replicate the main census approach because we do not hold data on relationships within households. However, we can use a breakdown similar to the census alternative composition.
One difference between census and ABHE as set out in Table 7, concerns the age boundary for older persons. Census 2022 outputs use 66+ years whereas our analysis, that was developed along Census 2011 definitions, used 65+ years.
Table 7: Census alternative household composition categories.
|
Household size |
Household composition |
|
One person households |
1 person 65+ 1 person 16–64 |
|
Other households |
0 adults or 1 adult, 1+ children (0–15) 2 adults (1+ 65+), 0 children (0–15) 2 adults (16+), 1-2 children (0–15) 2 adults (16–64) 2 adults (16+), 3+ children (0–15) 3 adults (16+), 1+ children (0–15) 3+ adults (16+)
|
These two classifications are different in that the NRS household estimates report by sex and include a definition of dependents, whereas the census reports on age breakdown, distinguishing between children, working age adults, and those eligible for state pension. Neither of these classifications include the addresses classed as communal establishments in the ABHE. The NRS classifications do not allow for dependents to be living alone, specifying an adult is present in each household, whereas the census classification acknowledges households may have 0 adults. The household compositions generated from ABHE methodology returns some households without adults; those are presented under ‘other’ when compared with NRS classifications.
Composition Comparison
Figure 15 shows the distribution of the households across the NRS classification for the 2022 ABHE and the NRS official estimates. This shows the distribution, rather than the total numbers, as otherwise the categories would merely reflect the lower total numbers for ABHEs.
Figure 15: Proportional distribution of household composition for NRS Estimates against ABHE (June 2022).
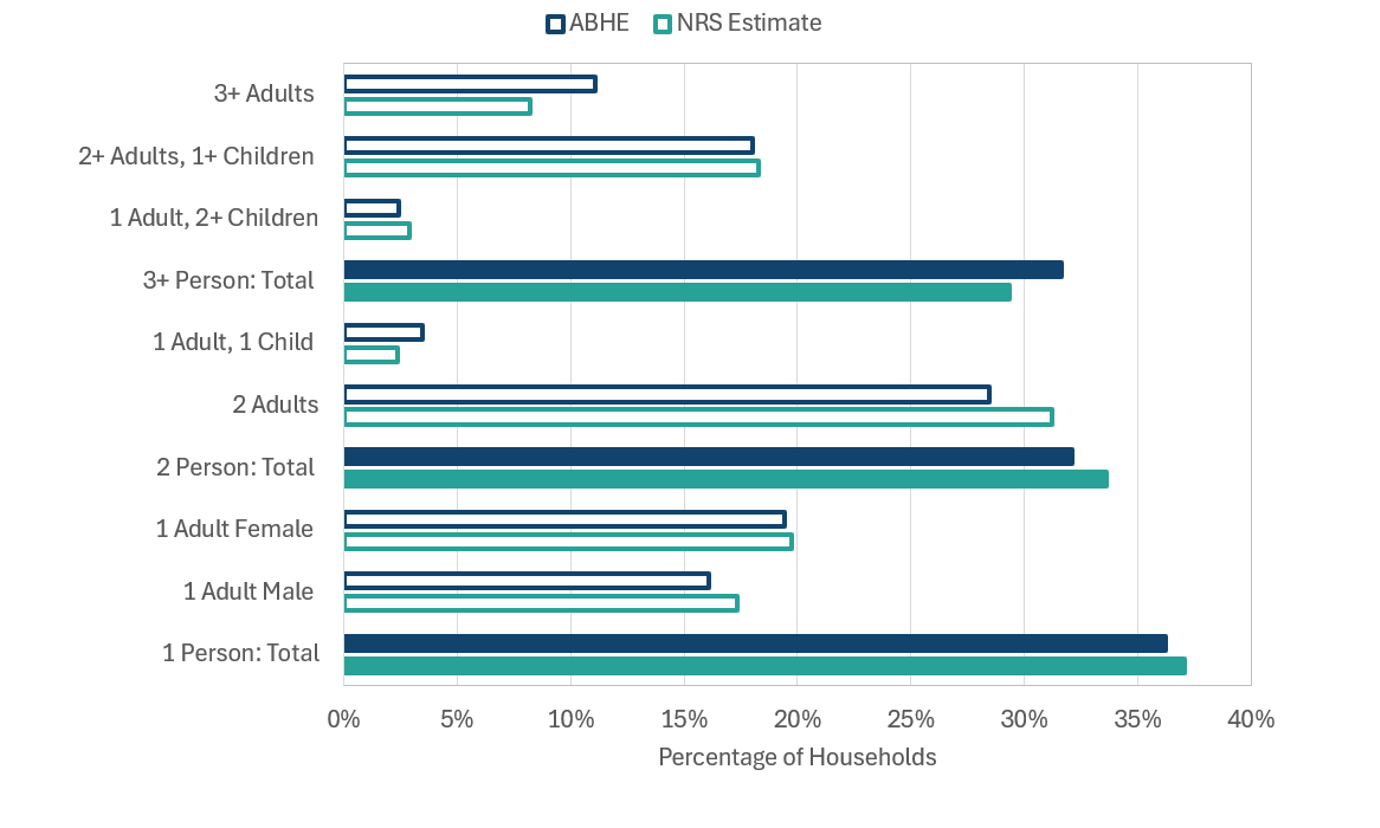
The ABHE has fewer one- and two-person households, and more households with three or more people. The difference in the proportion of one-person households is mainly due to households with one adult male. This may be partly because the SIDD has fewer males than the official estimates, particularly for people aged around 18–30 (see Figure 4). However, it could also be because adult males who are living alone are more likely than females to still be recorded on the administrative data sources at the same location as other people. The difference in the proportion of two-person households is due to the ABHE having fewer two-adult households. This could be due to the same effect as caused the difference in the proportion of households with one adult male. If an adult male was still recorded as living with their parents then that would count as one three-person household. If the son actually lived alone then this would result in overcount of households with three or more adults, and an undercount of households with two adults, and of those with one adult male. This hypothesis is strengthened by the observation that the ABHE has a higher proportion of households with three or more adults.
Figure 16 shows the distribution of households across the alternative census classification for March 2022 ABHE and 2022 Census estimates.
Figure 16: Proportional distribution of household composition for Census against ABHE (March 2022).
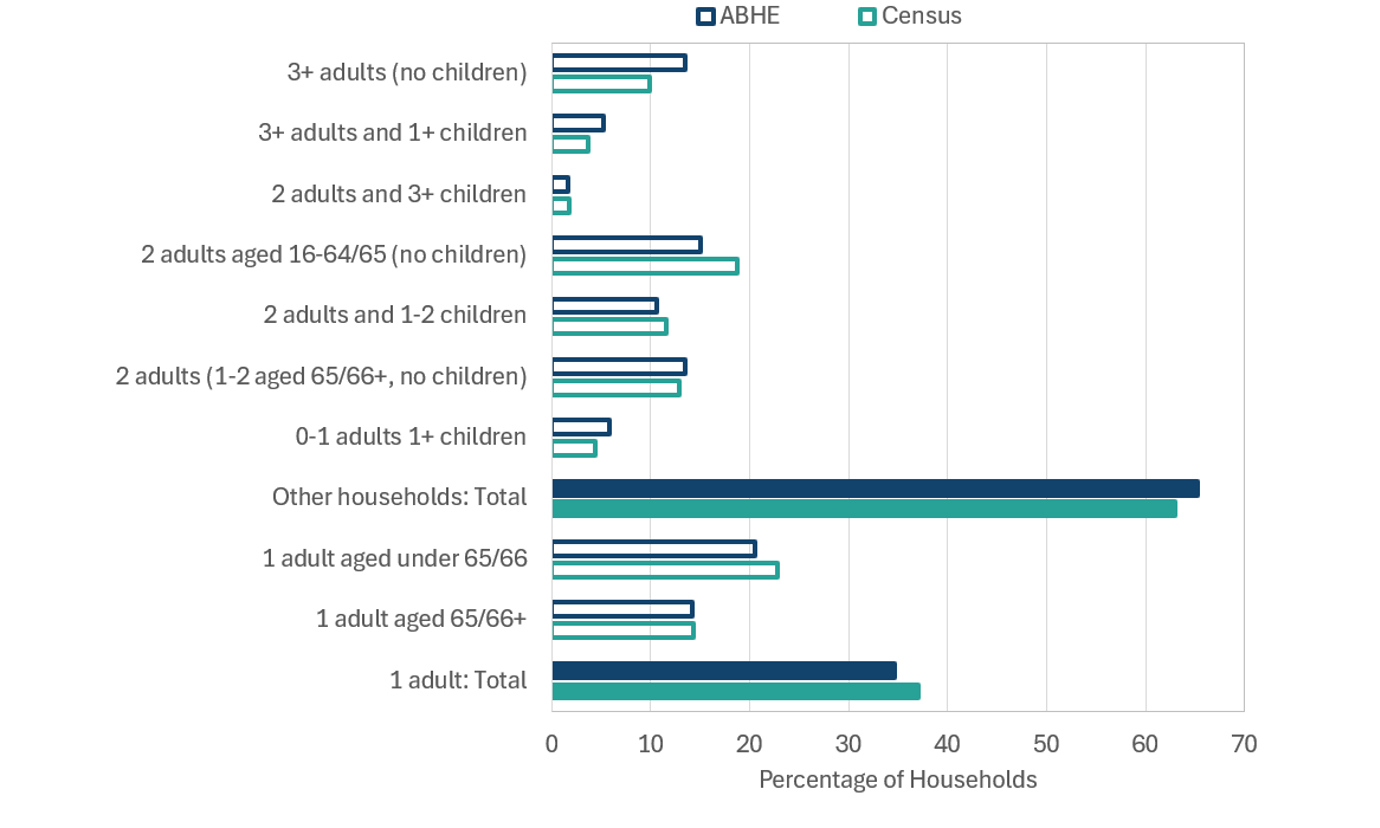
A similar pattern of proportional distribution is observed in the March 2022 data, with ABHE household composition being lower than benchmark for one-person households and higher where there are three or more adults in the household. The granular breakdown highlights the ABHE is low on one-person households aged under 65/66 years, and the NRS comparison above would indicate those are younger males in the population who are misallocated to households. This knowledge will allow future work to focus on that age group and sex. The proportion of households with three or more adults shows a notable difference, with the ABHE indicating a higher proportion of such households, but the plausible explanation has already been outlined above.
9 - Administrative Data Based Ethnicity Dataset
As part of administrative data research, NRS is investigating the feasibility of producing characteristics about the population of Scotland using administrative data. Administrative data based characteristic information could provide a consistent, timely and accurate evidence base to better inform the development and evaluation of policy in Scotland.
Data and statistics surrounding ethnicity or ethnic group is of high user need for both academic and policy officials, particularly for the analysis of inequalities, for which there has been a growing demand since the COVID-19 pandemic. NRS does not currently produce annual statistics on the population by ethnic group, with census publications being the only source. The Scottish Government produce statistics annually on ethnic group via the Scottish Survey Core Questions based on combining the samples of the main household surveys in Scotland.
The Office for National Statistics are also conducting research on administrative based ethnicity estimates and NRS will continue to work with them to ensure common methodologies and coherent statistics.
This is the first publication of information relating to the administrative data based ethnicity research by NRS and will describe the data sources, methods, research conducted to date and planned future research. This publication discusses the 2022 Administrative data Based Ethnicity Dataset (ABED) based on 20 March, the date of census collection. The ethnicity information from the administrative data is linked to the SIDD as the population base. The publication focuses on the proportions of people administrative data is able to establish an ethnicity for.
This publication will consider two methodologies:
- Estimates based only on administrative data
- Estimates based on administrative data combined with Census 2011
Census 2011 is used as an additional source because it maximises the use of data that is already collected, providing us with information on the people with ethnicity not captured by administrative data. Census 2011 was the most complete source of ethnicity information for Scotland at the time of analysis. Including the 2011 data in this research demonstrates the possibilities of including Census 2022 in future estimates. Both methods are still under research. Future publications will consider the most suitable approach for Scotland’s ABED, building on the research presented here.
The methodology is described in Section 10, including how the research deals with ‘not known’, ‘refused’ and missing responses.
Definitions
Recorded Ethnicity
Individuals with a recorded ethnicity have any ethnicity record on the admin data sources. This includes refused and not known responses. Anyone without a recorded ethnicity is regarded as having a missing ethnicity. This can happen when the ethnicity is blank on the administrative data or an individual appears on the SIDD but not on any of the four administrative datasets that record ethnicity.
Stated Ethnicity
Individuals with a stated ethnicity are those with a recorded ethnicity that is neither refused nor not known.
Data Sources
This research is based on the SIDD, with ethnicity information available from the Scottish Government’s School Pupil Census, HESA’s Student data, Scottish Funding Council’s Further Education dataset and Health Activity dataset from Public Health Scotland. The ABED has the same records as the SIDD, but with ethnicity added.
These datasets routinely collect ethnicity about individuals in Scotland.
Population Coverage
Administrative Data Only Method
The ABED includes a recorded ethnicity for 68.1 per cent of people. 58.2 per cent of individuals have a stated ethnicity record.
Administrative Data and Census 2011 Method
This method to select ethnicity first uses records from administrative data, then if an individual has a missing ethnicity or it is recorded as ‘not known’ their record from Census 2011 is selected, if available.
The combined administrative datasets and Census 2011 established a recorded ethnicity for 82.2 per cent of people on the ABED. 76.6 per cent have a stated ethnicity.
Age and sex
Figure 17 shows the proportion of the ABED with a stated ethnicity by age and sex using both methodologies.
This is highest for those aged 5–17 years. Most children are captured in the school pupil census, which includes all and only pupils in state run schools in Scotland. The dataset has few missing and not known ethnicity responses. There is also a high proportion of stated ethnicity for those aged 75 years and over after steadily increasing from 65 years. This is an age where interactions with health services increase, so individuals are captured more often and more recently on Public Health Scotland data.
The proportion of people with a stated ethnicity is lowest for those under 1 year of age, which was 28.04 per cent using both methods. Ethnicity is not captured on birth records in Scotland, so the ABED relies on the health activity dataset, which only includes specific types of interactions with the health service recording this until children reach school age. Individuals of this age will also not be captured in the
census data as the ABED is based on 20 March 2022, so the Census 2011 will not capture anyone below the age of 11.
The proportion of people with a stated ethnicity is higher overall for females than males. The largest difference between male and female is in the working-age group. Females proportion increases between ages 23 and 35. This is likely due to having more female than male records with a stated ethnicity on health activity data for this age group.
For people aged 0–4 years, males have a higher percentage of people with a stated ethnicity than females.
Local Authority
Figure 18 shows the proportion of individuals on the ABED with a stated ethnicity by Local Authority.
Figure 18: The proportion of people with a stated ethnicity in the 2022 Administrative data Based Ethnicity Dataset by Local Authority and sex.
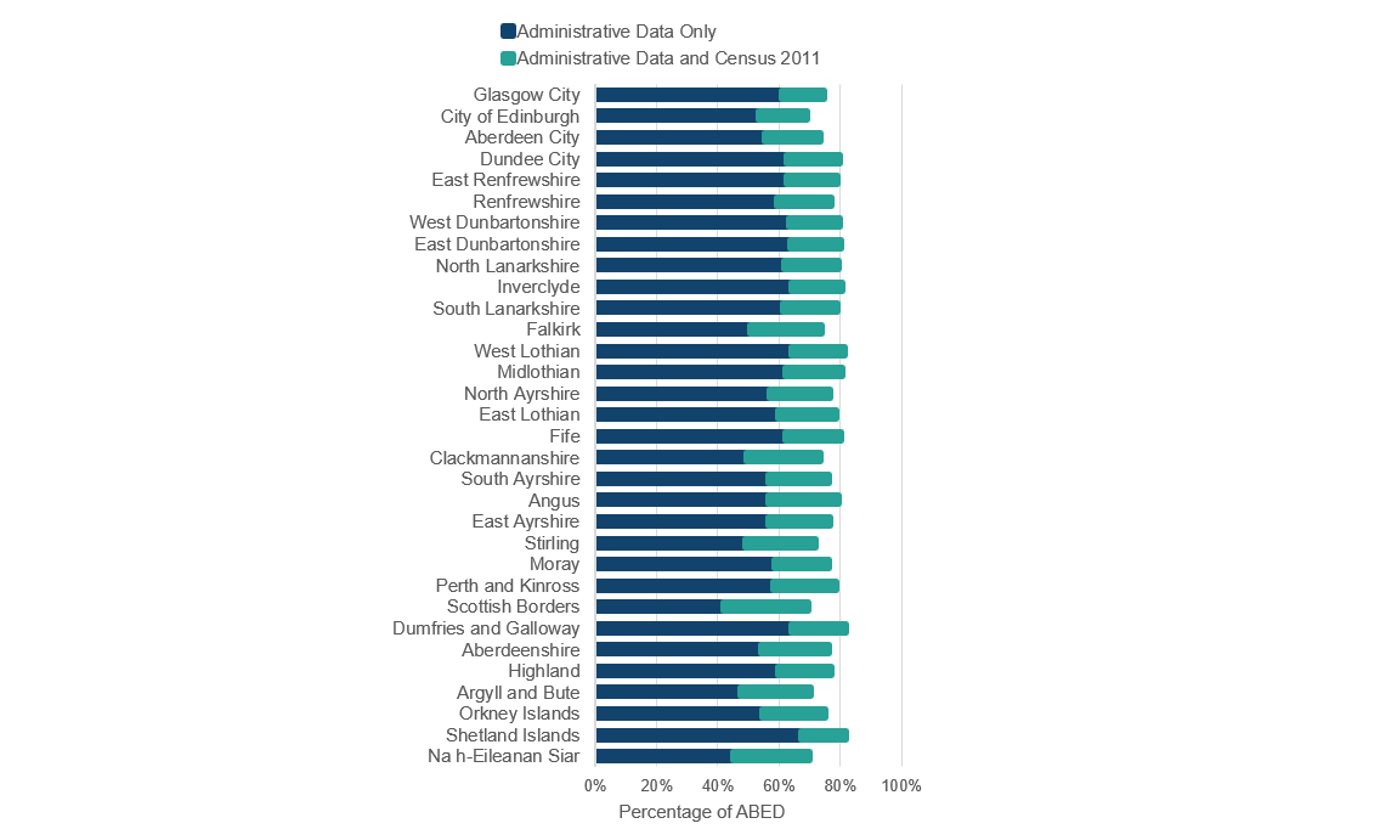
For the administrative data only method, this is highest in the Shetland Islands followed by West Lothian.
However, for the administrative data and Census 2011 method, the highest proportion of people with a stated ethnicity on the ABED lived in the Shetland Islands, followed by Dumfries and Galloway. West Lothian was the third highest.
The proportion of people with a stated ethnicity for the administrative data only method is lowest in the Scottish borders followed by Na h-Eileanan Siar.
For the administrative data and Census 2011 method, the City of Edinburgh, followed by the Scottish Borders, had the lowest proportion. Na h-Eileanan Siar was the third lowest. The difference in the proportions compared to the administrative data only based method may be attributed to the differing migration patterns to the City of Edinburgh, which would see fewer people captured as living in Scotland by the previous Census in 2011.
Scottish Index of Multiple Deprivation (SIMD)
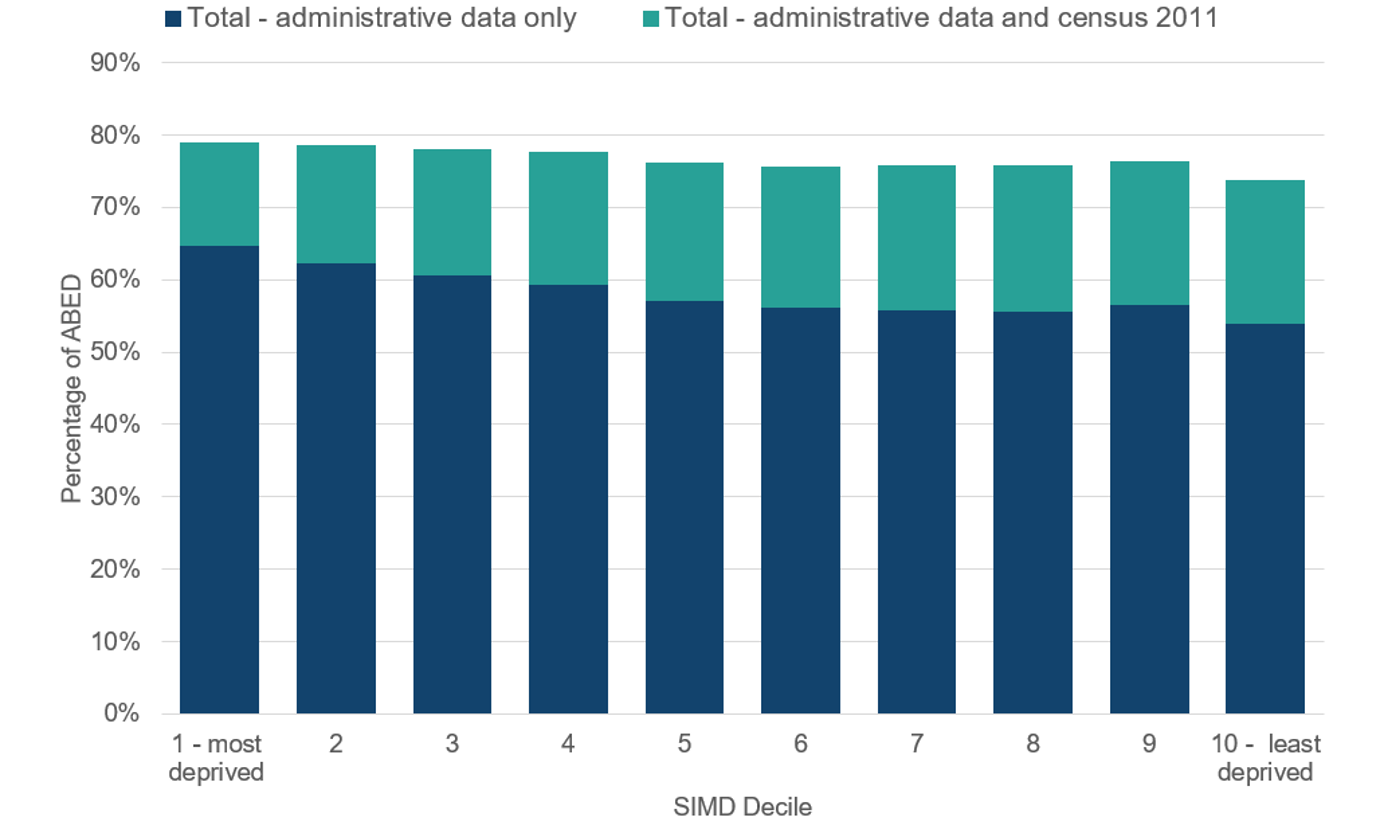
Figure 19 shows the proportion of people with a stated ethnicity by Scottish Index of Multiple Deprivation (SIMD) decile. In the administrative data only method, the proportion with a stated ethnicity is highest in the most deprived decile and lowest in the least deprived decile. This is driven by lower proportion than average of each of the missing, refused and not known ethnicities in the most deprived areas and higher proportion than average for all of these in the least deprived areas.
In the administrative data and Census 2011 method, the least-deprived SIMD decile had the lowest proportion of people with a stated ethnicity. Results vary slightly with the other deciles but the trend increases from decile 5 to the first decile, with the highest percentage of people with a stated ethnicity in the most-deprived decile.
Figure 19: The proportion of people with a stated ethnicity in the 2022 Administrative data Based Ethnicity Dataset by Scottish Index of Multiple Deprivation (SIMD) and sex.
Comparison to Scotland’s Census 2022
The administrative data based ethnicity research conducted was based on 20 March 2022, allowing direct comparison to Scotland’s Census 2022. Scotland’s Census provides the only official statistics on ethnic group published by National Records of Scotland.
For both methods described in this publication, the ABED contains a smaller proportion of individuals across all of the known ethnic groups when compared to Census 2022. This is because of the availability of two categories – refused and not known – which are not available in published census results because missing values are imputed. Future research will include investigating imputation methods for the ABED.
Comparing the datasets’ proportions using only those with a stated ethnicity from the administrative data based methods, the proportions in each of the ethnic groups broadly align to Census 2022, with the administrative data only based method aligning more closely. NRS will conduct further analysis on the ethnic groups in the ABED compared to Census 2022.
Available Ethnic Group Categories
The number of ethnic group categories of response varies by source dataset (see Table 8). The ABED contains 40 categories as a result of combining the administrative datasets where ethnicity is collected.
Table 8: The number of ethnic group categories collected in administrative data and Census 2022
|
Dataset |
Number of Categories |
|
School Pupil Census |
19 |
|
Health Activity |
40 |
|
HESA |
21 |
|
Further Education Statistics |
24 |
|
Published Census 2022 |
22 |
|
Administrative data Based Ethnicity Dataset |
40 |
To compare with published Census 2022, some of the administrative data categories could be combined to provide the published census categories, for example White – English, White – Welsh and White – Northern Irish could be compared with the census White – British category. However, where there is the option to provide the breakdown by the smaller groups in the ABED this has been used within this research.
In Census 2022, there is also an option to write a response to the question. There are almost 400 categories of response which are not included in the 22 categories above. The 2022 write-in option results are available on the Census website.
In future publications on administrative data research, where estimates are produced, the categories published will need to comply with statistical disclosure control to ensure that no individuals can be identified. Therefore, larger overarching categories, in line with census categories, may be used.
The category ‘White: Showman/Showwoman’ available in Census 2022 was not available or had no returns on any of the source administrative datasets for 2022.
Ongoing discussion with data providers, the Office for National Statistics, and the Scottish Government’s Equality and Social Justice Analysis Division will consider harmonisation and the availability of categories across the source administrative datasets.
10 - Methodology
ABPE Version 1, 2 and 3 Methodology Summary
The methodology behind the production of the ABPEs generated thus far is fully documented in previous publications and methodology reports available on National Records of Scotland website. Version 1, which was used in the first ABPE publication on 2016 data, is described in the accompanying methodology report at: Administrative Data Based Population Estimates, Scotland 2016 - Statistical Research | National Records of Scotland (nrscotland.gov.uk). Version 2 was used in the second ABPE publication on 2016–2018 data. Differences between versions 1 and 2 are described at: Administrative Data Based Population Estimates, Scotland 2016 - 2018 - Statistical Research | National Records of Scotland (nrscotland.gov.uk). Version 3 was used in the third ABPE publication on 2016–2018 data. Differences between versions 2 and 3 are described at: Administrative Data Based Population Estimates using version 3 methodology 2016-2018 | National Records of Scotland (nrscotland.gov.uk).
In summary, linking variables were derived from four pieces of information: name, sex, date of birth and postcode. All personal data and all variables derived from them are de-identified to make it impossible to recover the original information. This means we cannot identify individuals. The de-identified versions of the datasets listed in Table 1 are sent to the National Safe Haven, and then linked together using the de-identified linking variables.
Once the de-identified records have been linked together the links are analysed. Records that appear to represent the same person are pulled together into a group, with unlinked records being placed in distinct groups. Each group is given a UPID (Unique Person Identifier). Some UPIDs will represent persons who are not in the Scottish population on the reference date. Therefore, to make the list of UPIDs closer to the list of persons living in Scotland on the reference date, business rules are applied. The business rules trim down the list of UPIDs, for example removing persons who appear on the death registrations dataset. There are some exceptions, but in general UPIDs will be included if the person appears on the NHSCR with an active posting, and on at least one other dataset. Changes to the business rules will change the final list of UPIDs and hence the population estimates.
For each person an age, sex and (de-identified) postcode is assigned. A lookup from de-identified postcode to various levels of geography (from local authority down to data zone) is used to place each person in the appropriate area. NRS use administrative datasets where sex or gender is self-declared. The ABPEs use the term sex for reporting but we are aware that this variable may contain sex and/or gender from the underlying dataset. For most UPIDs the sex information will be derived from the Health Activity dataset, which is itself an amalgamation of various health datasets.
Once completed, the trimmed UPID list constitutes Scotland's Integrated Demographic Dataset (SIDD). This statistical dataset includes a record for each person estimated to be in the Scotland population on the reference date. For each record it includes the age, sex and location of that person down to data zone level. However, details such as name, date of birth and postcode are not known as they have been de-identified. The SIDD is the dataset used to estimate the population. The population estimates (ABPEs) are counts of records on the respective SIDD for each year.
ABPE Version 4 Methodology
Linking
During census 2022 processing, an administrative data spine was constructed using a similar set of datasets as are used in producing the ABPEs. The use for this in the census is described here: Scotland's Census 2022: Securing high quality Census outputs and Population Estimates | Scotland's Census (scotlandscensus.gov.uk). The datasets used for this spine were linked in the clear (that is, not using deidentified), and used clerical review, in order to maximize the quality of the links that would be used in census estimation. The availability of these high-quality links afforded the opportunity to test the deidentified linking method used for the ABPEs. The datasets linked for the administrative data spine were therefore linked again using the deidentified linking method. This meant that the set of links found using each method could be compared to explore the extent of differences, and the reasons for these.
Encouragingly there were comparatively few differences between the methods. More than 99 per cent of the links originally made were made by the deidentified method, and more than 99 per cent of the links made by the deidentified method had been originally made. Investigating the residuals revealed that some of the links originally made would have been very difficult for any deidentified linking method to have found. However, there was a group of originally made links that were found by the deidentified linking method, but were discarded as not being strong enough. These were links between records representing adult females where the surname differed between the records, and the clerical reviewer felt that it was plausible that these records represented a woman who used her maiden name on one source but their married name on another.
In order to ensure these type of links would be found, two changes were made. The first was to reduce the penalty associated with records having different surnames where the record represented an adult female. The other change was to make use of the previous name information that is available on the NHSCR. It is believed that these two changes will bring the deidentified method even closer to the standard achieved by the linking in the clear method.
Business Rules
The business rules have also been amended for version 4. These changes were informed by comparisons between the ABPE and the census, both for the aggregate estimates, and using individual-level comparisons. To avoid overfitting to the census, changes have only been made when they simplify the rules.
Students
For version 4 the rules around which students to add have been simplified. In version 3 HESA students studying in Scotland in the academic year leading to the reference date, who were not on NHSCR with an active posting were only included if
- They were domiciled in the rest of the UK (home address not in Scotland), on a course that has not finished, and either 1) they were not on the NHSCR, or 2) they were showing as having moved elsewhere on the NHSCR
- They were domiciled in Scotland, on a course that has not finished, and they were showing as having moved elsewhere on the NHSCR.
For version 4 this was simplified to include all HESA students aged 18 to 22 unless one of the reasons for exclusion applies (including that the student is recorded on HESA as studying elsewhere in the UK, but ignoring an NHSCR posting indicating that they have left Scotland). The 18 to 22 age range corresponds roughly with ages of most undergraduate students.
The above rule for HESA students is also applied to FES students, unless they are recorded as a distance learner.
Health activity
For version 4 the health activity rules have also been simplified. In version 3 the last interaction thresholds differed across four different age bands. For version 4 these were reduced to three different age bands, with the following thresholds:
- 0–22: 2 years
- 23–34: 1.5 years
- 35+: 1 year
Administrative data Based Ethnicity Dataset Methodology
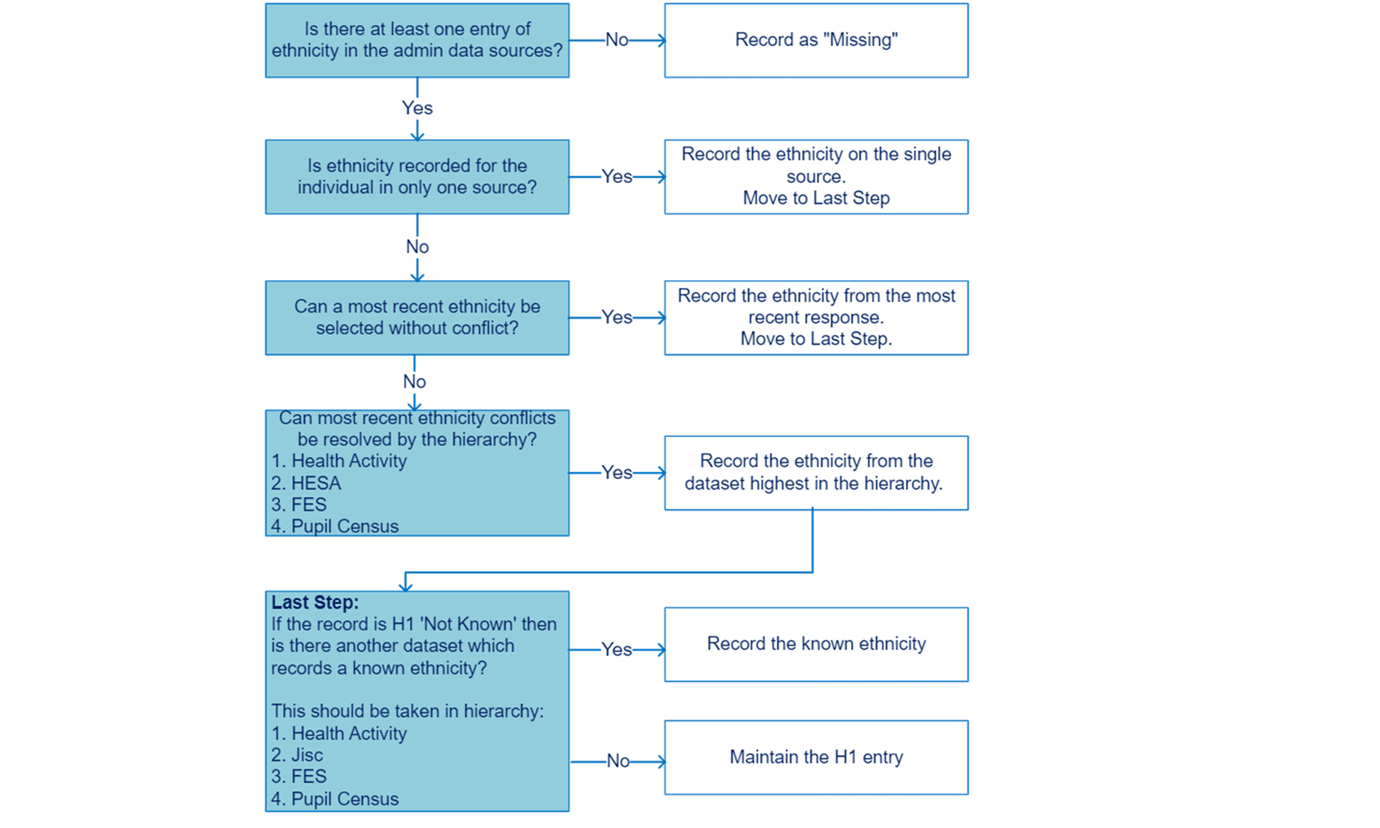
The ethnicity assigned to an individual is based on selecting the most recent ethnicity entry across the source datasets for both the administrative data based method and the administrative data and Census 2011 based method.
Administrative data only based method
The administrative data only based method determines the most recent date of interaction to select ethnicity.
This is based on:
- Health Activity – latest date of interaction. Individuals may not have updated or confirmed their ethnicity on this date
- HESA – end date of the student’s course. For any dates after September 2021, these are reset to September 2021. All other dates are after the collection date as it is the students’ expected end date of course.
- Further Education Statistics – start date of the student's course
- School Pupil Census – the date the pupil census was conducted, in September each year. The 2022 pupil census was conducted on 14 September.
If there are multiple records with the same date, or there is no date available, then the ethnicity is selected in order of:
- Health Activity
- HESA
- Further Education Statistics (FES)
- School Pupil Census (SG)
This order was selected based on the likelihood that individuals would enter higher education more recently than further education or school education, and that most adults would likely have interacted with the health service after this period.
After this, if an individual has a ‘not known’ response, then another known ethnicity is selected if available from the other sources.
The selection methodology is pictured in the flow chart in Figure 20.
Figure 20: Ethnicity Selection – Administrative Data Only Based Method
Administrative data and Census 2011 Method
To improve the coverage and number of records with a known ethnicity in the ABED, NRS is also investigating the impact of including Census 2011 returns in the dataset. Census 2011 returns were only used when all of the administrative datasets produced a missing or ‘not known’ response.
The methodology follows the steps for the administrative data based method, selecting the most recent date first and then follows an order for selection if there is conflict or no date available. After this, if an individual has a ‘not known’ response, then another known ethnicity is selected, if available, from the other administrative data sources as described above. Following this, if the response is still ‘not known’ then the Census 2011 response is taken, if available. Lastly, if the individual has a missing ethnicity, the Census 2011 response is taken, if available. The selection methodology is pictured in Figure 21.
Figure 21: Ethnicity Selection - Administrative data and Census 2011 Based Method
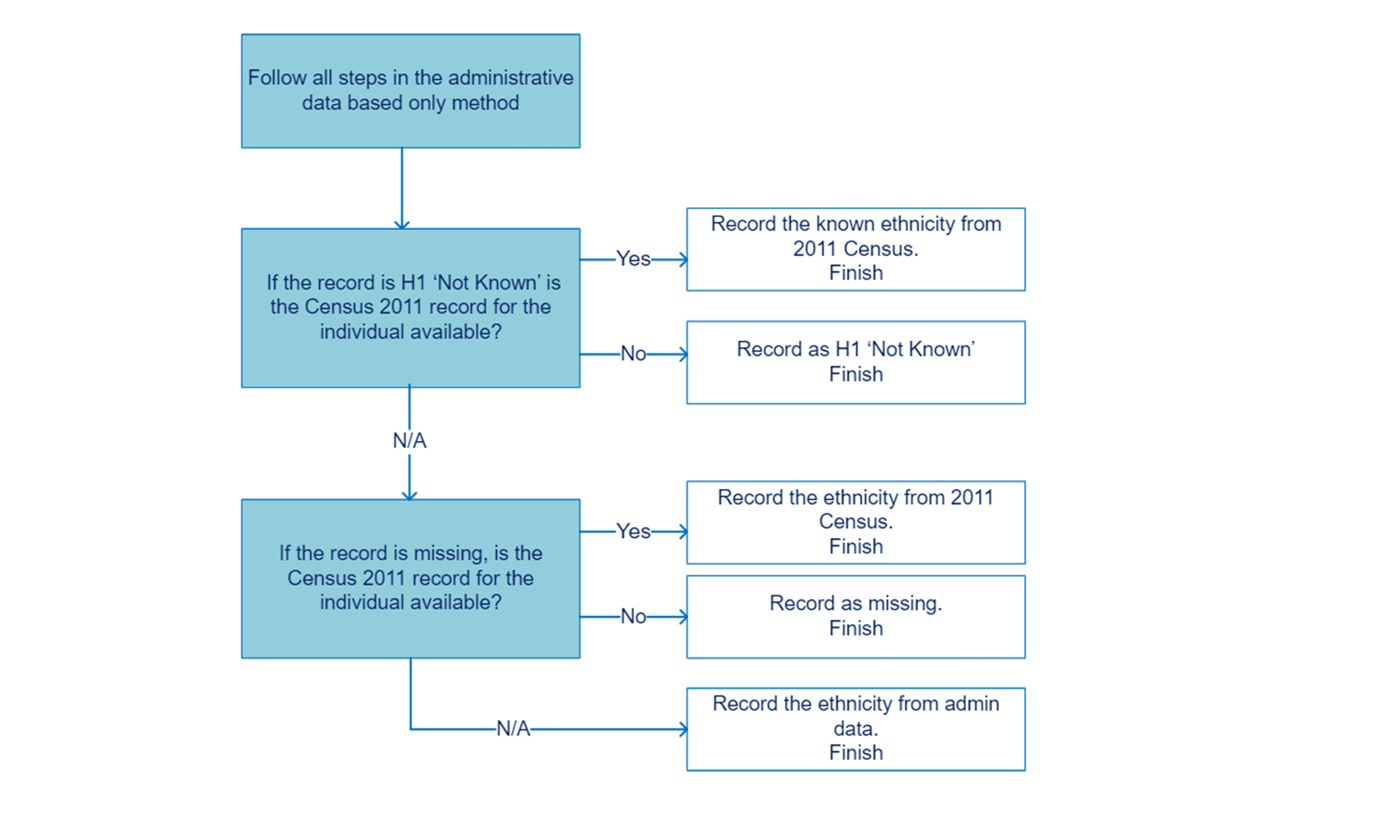
Dealing with unknown, refused, or missing values
Not Known
The value ‘not known’ can be assigned from any of the four administrative datasets.
To try to reduce the number of unknown responses, if the latest response is ‘not known’ then the next available administrative data record value is assigned if available. In the administrative data and Census 2011 based method, this first assigns the next available administrative data record, if available, then only if there is no known ethnicity recorded in the administrative data, assigns the Census 2011 record.
Missing
Missing or blank values on administrative data are treated as missing for the administrative data based method. Missing values can also be generated if there is no record on the administrative datasets for an individual, but they appear on the SIDD.
In the administrative data and Census 2011 based method, if there is a missing record with a known ethnicity in the corresponding Census 2011 record, this is selected. Otherwise, a missing response is recorded.
Refused
The value ‘refused’ can be assigned as the ethnicity for an individual from the School Pupil Census response ‘not disclosed,’ Health Activity response ‘refused/not provided by patient,’ HESA response ‘information refused’ or Further Education Statistics response ‘prefer not to say’.
Refused responses in both methods are treated as a valid ethnicity and are not replaced in any way if ‘refused’ is the latest available, even when another ethnicity is available in a different source.
11 - Future Developments
Administrative Data Based Population Estimates
These outputs are statistical research and the comparisons between them and other estimates will continue to be investigated. When comparing to the census, our analysis shows that nearly all of the population are captured on administrative data. However, when we apply our business rules to estimate who is still active in the population, we see that some groups are more difficult to capture.
NRS is working to secure new administrative datasets, including Department for Work and Pensions (DWP) and His Majesties Revenue and Customs (HMRC) which would provide additional information on these groups.
More research is required into why the ABPE trend fluctuates more than the MYE. This research would include further interrogating the underlying data, considering ONS migration pattern data and work to quantify random error from our modelling.
NRS are thinking broadly about administrative data research and what would be the best combination of administrative data, census data and surveys in counting the Scottish population. This work would include estimation techniques to supplement this data-based approach. NRS are working closely with other statistical institutions in the UK and internationally to take this work forward.
Administrative Data Based Household Estimates
Future work will use a list of communal establishments maintained by the NRS Geography team (the Communal Establishment Register) to partition the SIDD into a dataset of individuals in communal establishments and a dataset for those in households. This will provide a more-refined classification for household analyses and would bring the methodology into closer alignment with NRS Household methods.
Future analyses will adopt 66+ age boundary for the breakdown of household composition. This is a minor change, but one that needs to be monitored going forwards to accommodate the increasing state pension age.
Securing additional data sources that have UPRN attached will improve the accuracy of household groupings. Such sources include Council Tax data, HMRC and DWP.
A number of adjustments to SIDD have been explored to increase the accuracy of household numbers and composition, but these require further investigation to fully understand the impact they have. Refinements were made, seeking to address issues where no household classification was identified, or where child-only households were identified; all with the aim of getting the best household profile for a resident population from administrative data. There are currently the following three main steps that have resolved concerns to some extent.
Electoral Register Adjustment
The Electoral Register (ER) is regarded as a strong indicator of location and a person’s presence in the population. This step includes persons who are on ER, and not currently on SIDD due to failing the business rules. It also removes persons who do not appear on ER if there are other persons at that UPRN who appear on the NHSCR and ER. For example, suppose a person was still recorded on health data as living with their parents, but had actually moved out. ER might have them at the correct location as the Electoral Register Officers write out each year to confirm who is at each address. As our ER data does not include date of birth, that record might fail to link to the health data for the person. The SIDD would include the person at their parents’ address, but the adjustment would then include the person at their ER location. If their parents were on the ER, but this person was only on health data at that location, then they would be removed from their parent’s address. This would correctly reduce the size of the parent’s household, and correctly increase the size of the HH where the person actually lives. If the person lived alone then this adjustment would also correctly increase the total number of households.
Adjustment for Child-only Households
This adjustment is applied to records for children who have missing UPRN, or who are in child-only households. This assigns them to the same household as their parents, prioritised on their mother’s UPRN if the parents are at different locations. Children are connected to their parents using the birth registration data, so can only be applied to children born in Scotland from 2011 onwards (we have data on birth registrations from 2011 to 2022).
UPRN by PC–last
This step is the final attempt to group together records that remain problematic. These are records with missing UPRN, or records for children at a UPRN where no adults have been assigned. This adjustments groups these records together with individuals with the same postcode and last name.
To date those three steps have produced some useful insights, but are still under development.
Administrative Data Based Ethnicity Research
This research is currently experimental and shows the potential for the ability to produce ethnicity statistics using administrative data.
NRS will continue to conduct research on administrative data based ethnicity in Scotland and plan to explore these improvements further:
- Engage further with data providers and support improvement of ethnicity data collection programmes
- Continue to engage with new data suppliers in Scotland and the UK to request access to further data sources that could provide administrative data coverage to this research, as well as the wider administrative data based statistics
- Further explore statistical methods to adjust for the missing responses from administrative data
- Further discuss harmonisation and available number of ethnic group categories with the Scottish Government, Office for National Statistics and data providers
- Continue to look at trends within ethnic groups in comparison with 2022 Census
- Review the business rules to select ethnicity (where it is available on multiple sources) to incorporate new data sources or improvements to current collections
- Review the level of geography that the ABED can be provided at. The lowest to date is at Local Authority level
- Collect views from users on this research through User Engagement events
12 - Background Note
Revisions
This publication presents the fourth version of the ABPE methodology. It is planned that all subsequent ABPEs, up to the end of the current project, will use this version of the methodology.
Methodology version 1 – Administrative Data Based Population Estimates v1 Scotland 2016
Methodology version 2 – Administrative Data Based Population Estimates v2 Scotland 2016–2018
Methodology version 3 – Administrative Data Based Population Estimates v3 Scotland 2016–2018
Revisions and corrections to previously published statistics are dealt with in accordance with the Scottish Government Statistician Group corporate policy statement on revisions and corrections.
International contexts for administrative data based population estimates
Both nationally and internationally, various approaches for producing population estimates with administrative data have been researched and adopted.
Within the UK
The Office of National Statistics (ONS) is carrying out a future of population and migration statistics programme for England and Wales. This work aims to produce more timely and frequent local area statistics about the size, structure and characteristics of the population, driven by the needs of policymakers and decision-makers. Previously, ONS developed their administrative based population estimates, referred to as the Statistical Population Dataset (SPD). These estimates were created by linking records from various administrative data sources and removing records of individuals unlikely to be usual residents. The SPD was used as a basis for producing their Admin-Based Household Estimates (ABHEs).
Building on the SPD they have developed a Dynamic Population Model (DPM). This approach uses Bayesian methods to combine a range of inputs including the SPD alongside other administrative data sources and survey data, providing a more flexible and adaptive estimation method.
The Northern Ireland Statistics and Research Agency (NISRA) has explored the use of administrative data to enhance the accuracy and timeliness of population estimates. Their Statistical Population Dataset (SPD) publication details research using a range of administrative data sources to estimate the usual resident population by age and sex at the national level and sub-geographic level. These estimates are also compared with census data to assess their accuracy.
Outwith the UK
As part of their Census transformation programme, Statistics New Zealand (Stats NZ) has been experimenting with using administrative data to estimate various characteristics of the population. They have developed the experimental Administrative Population Census (APC), which uses linked administrative data to estimate population counts and characteristics. This is aided by their Integrated Data Infrastructure (IDI) a large research database containing microdata on people and households. Stats NZ has already integrated administrative data into their 2018 and 2023 censuses to fill gaps in census records. Looking ahead, Stats NZ aim to adopt an admin-data-first approach for the 2028 Census using mostly existing data to get census information then supplementing it with surveys if needed.
The Australian Bureau of Statistics (ABS) has used administrative data to provide a snapshot of Australian population and housing statistics. The Administrative Data Snapshot of Population and Housing (ADS) is created by capturing the population at a point in time through integrated administrative data sources from the Multi-Agency Data Integration Project (MADIP). MADIP is a secure population data asset combining various administrative data sources over time. ABS also used administrative data in improving the quality of their 2021 Census specifically for estimating the population in households that did not return a census form but were identified as occupied on census night.
Statistics Canada has been researching the use of a "combined census" approach to enhance the efficiency and quality of census operations while reducing the burden on individuals from multiple data collection. The combined census merges the collection of information directly from respondents with administrative data sources. This research proved useful during their 2021 Census, where collection challenges arose. By leveraging administrative data, Statistics Canada implemented innovative solutions, including a modelling approach to predict the quality of administrative data for households with low response rates.
Ireland’s Central Statistics Office (CSO) have produced experimental statistics that are based on administrative records. Their most recent Irish Population Estimates from Administrative Data Sources (IPEADS) attempts to estimate the population of Ireland in April 2022.
The United States Census Bureau also has some research on producing population estimates using administrative data. Their publication Real-Time 2020 Administrative Record Census Simulation describes their process of creating estimates of the U.S. population in 2020 using administrative data.
13 - Glossary
The table below provides a description of the abbreviations used in this document.
|
Abbreviation |
Description |
|
ABED |
Administrative Data Based Ethnicity Dataset |
|
ABPE |
Administrative Data Based Population Estimate |
|
ABHE |
Administrative Data Based Household Estimate |
|
ADRS |
Administrative Data Record Set |
|
eDRIS |
electronic Data Research and Innovation Service |
|
ER |
Electoral Register |
|
ERO |
Electoral Register Officer |
|
FES |
Further Education Statistics |
|
HESA |
Higher Education Statistics Agency |
|
MYE |
Mid-Year Estimate, used here to specifically indicate the 2011-based estimates |
|
NHSCR |
National Health Service Central Register |
|
NISRA |
Northern Ireland Statistics and Research Agency |
|
NRS |
National Records of Scotland |
|
ONS |
Office for National Statistics [UK] |
|
PHS |
Public Health Scotland |
|
R-MYE |
Rebased Mid-Year Estimates, includes the March 2022 Census estimate and the 2022-based June 2022 estimate |
|
SFC |
Scottish Funding Council |
|
SG |
Scottish Government |
|
SIDD |
Scotland’s Integrated Demographic Dataset |
|
SIMD |
Scottish Index of Multiple Deprivation |
|
SPD |
Statistical Population Dataset |
|
UPID |
Unique Person Identifier |
|
UPRN |
Unique Property Reference Number |
14 - Notes on statistical publications
Statistical Research
This publication presents statistical research and the methodology is still under development. We welcome any feedback from users on ways in which the methodology or data sources may be developed to improve the quality of these statistics in future years.
Information on background and source data
Further supporting documentation is published alongside this publication on the Scotland’s Census website.
National Records of Scotland
We, the National Records of Scotland, are a non-ministerial department of the devolved Scottish Administration. Our aim is to provide relevant and reliable information, analysis and advice that meets the needs of government, business and the people of Scotland. We do this as follows:
Preserving the past – We look after Scotland’s national archives so that they are available for current and future generations, and we make available important information for family history.
Recording the present – At our network of local offices, we register births, marriages, civil partnerships, deaths, divorces and adoptions in Scotland.
Informing the future – We are responsible for the Census of Population in Scotland which we use, with other sources of information, to produce statistics on the population and households.
You can get other detailed statistics that we have produced from the Statistics section of our website. Scottish Census statistics are available on the Scotland’s Census website.
We also provide information about future publications on our website. If you would like us to tell you about future statistical publications, you can register your interest on the Scottish Government ScotStat website.
Enquiries and suggestions
Please get in touch if you need any further information, or have any suggestions for improvement.
Lead Statistician: David Rowley
For enquiries, please contact [email protected]
For all other enquiries, please contact [email protected]
© Crown Copyright
You may use or re-use this information (not including logos) free of charge in any format or medium, under the terms of the Open Government Licence. Further information is available within the Copyright and Disclaimer section of the National Records of Scotland website